Enterprise Command Center
This chapter provides details on the G-Invoicing dashboard available in the Projects Command Center.
This chapter covers the following topics:
- Setting Up RBAC for Enterprise Command Center Dashboard
- Setting Up Projects Command Center
- Setup and Configuration Steps
- Projects Profile Options
- Configuring Descriptive Flexfields for Search
- Loading Projects Command Center Data
- Business Rules and Validation
- G-Invoicing Dashboard
- Loading Projects Command Center Data
Setting Up RBAC for Enterprise Command Center Dashboard
-
For information about setting up RBAC for ECC, refer to My Oracle Support Knowledge Document 2821769.1, Installing Oracle Enterprise Command Center Framework, Release 12.2 V7 (Doc ID 2821769.1).
-
A new role, PA_ECC_FED_ACCESS_ROLE, is required for the G-Invoicing tab to appear in the Projects Command Center. Follow the MOS Note to add this role to the required responsibility.
Projects Command Center Configuration
Setting Up Projects Command Center
The Projects Command Center product configuration setup must be completed after the installation and common configurations are completed as described in My Oracle Support Knowledge Document 2495053.1, Installing Oracle Enterprise Command Center Framework, 12.2.
Setup and Configuration Steps
To complete setup of the Oracle Projects Command Center, you must perform the following:
Projects Profile Options
You must set the following profile option for loading data up to twelve (12) months:
| Profile Option Name | Description |
|---|---|
| PA: ECC Data Load Month | The PA:ECC Data Load Month profile option provides the flexibility of loading data for up to twelve (12) periods for Costing, Capital, Billing, and Financial Flow dashboards. This site level profile option is relevant only for Full load and is not considered for Incremental load. Any modifications to the value of this profile option requires a Full load to be run to display the appropriate data in the dashboards. Behavior of the data load based on this profile option includes:
|
Configuring Descriptive Flexfields for Search
Enterprise command centers support Descriptive Flexfields (DFFs) that enable you to search on DFF attributes. After you configure DFFs, you must run the full data load process, which ensures that the DFF attributes are available in the command center.
For additional information on configuring and customizing flexfields, see the Oracle E-Business Suite Flexfields Guide and My Oracle Support Knowledge Document 2495053.1, Installing Oracle Enterprise Command Center Framework, Release 12.2.
The following table describes the DFFs available in the Projects dashboards:
| Dashboard | Data Set | DFF Title | DFF Name | DFF Attribute Group Name |
|---|---|---|---|---|
| Budgetary Control Dashboard | pa-ds-cost-bcbalances | Tasks | PA_TASKS_DESC_FLEX | Task Additional Details |
| Capital Dashboard | pa-ds-cost-eicdl | Expenditure Items Tasks | PA_EXPENDITURE_ITEMS_DESC_FLEX | Expenditure Items Additional Details Task Additional Details |
| Costing Dashboard | pa-ds-cost-eicdl | Expenditure Items Tasks | PA_EXPENDITURE_ITEMS_DESC_FLEX | Expenditure Items Additional Details Task Additional Details |
| Billing Dashboard | pa-ds-cost-eicdl | Expenditure Items | PA_EXPENDITURE_ITEMS_DESC_FLEX | Expenditure Item Additional Details |
| Billing Dashboard | pa-ds-cost-eicdl | Events | PA_EVENTS_DESC_FLEX | Events Additional Details |
| Billing Dashboard | pa-ds-bill-revenueinvoice | Draft Invoices | PA_DRAFT_INVOICES_DESC_FLEX | Event or Expenditure Details |
Loading Projects Command Center Data
Run the Projects Costing Budgetary Control ECC Data Load, Projects Costing and Billing ECC Data Load, Projects Financial Flow ECC Data Load, and Projects G-Invoicing ECC Data Load concurrent programs to load data for the Projects dashboards. You can navigate to these concurrent programs from the Requests page in Oracle Projects.
Before you load data from Oracle E-Business Suite into the Oracle Projects Command Center, ensure that your EBS data is accurate and current by running any concurrent programs that impact attributes used in the command center.
The Costing dashboard has been designed so that a minimum of one Expenditure Item (EI) is required to display multiple metrics, chart sections, and summary level result tables. For any task level information or project level information to display on the dashboard, you must select a minimum of one EI against the task or project. This also applies to the refinement, as the dashboard is EI based. The refinements on the dashboard or the association of different tables on the dashboard depends on the data in the Overview table.
Run the concurrent program from the Search and Select page.
To load Projects Costing and Billing data
-
From the Projects menu, navigate to the Search and Select page:
(N) Projects > Requests > Schedule
-
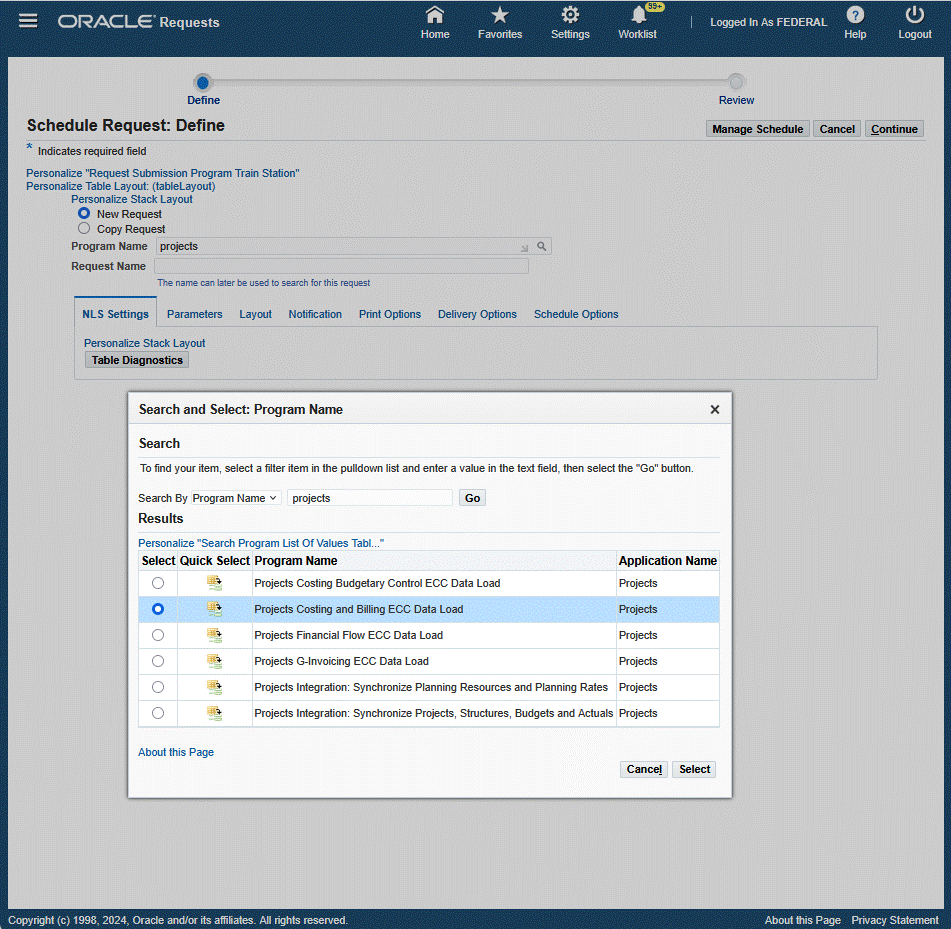
Click the New Request button and perform a search for Projects Costing Budgetary Control ECC Data Load, Projects Costing and Billing ECC Data Load, Projects Financial Flow ECC Data Load, and Projects G-Invoicing ECC Data Load. The Search and Select page appears.
-
Select the button for your specific data load run and then click the Select button. The Schedule Request: Define page appears.

-
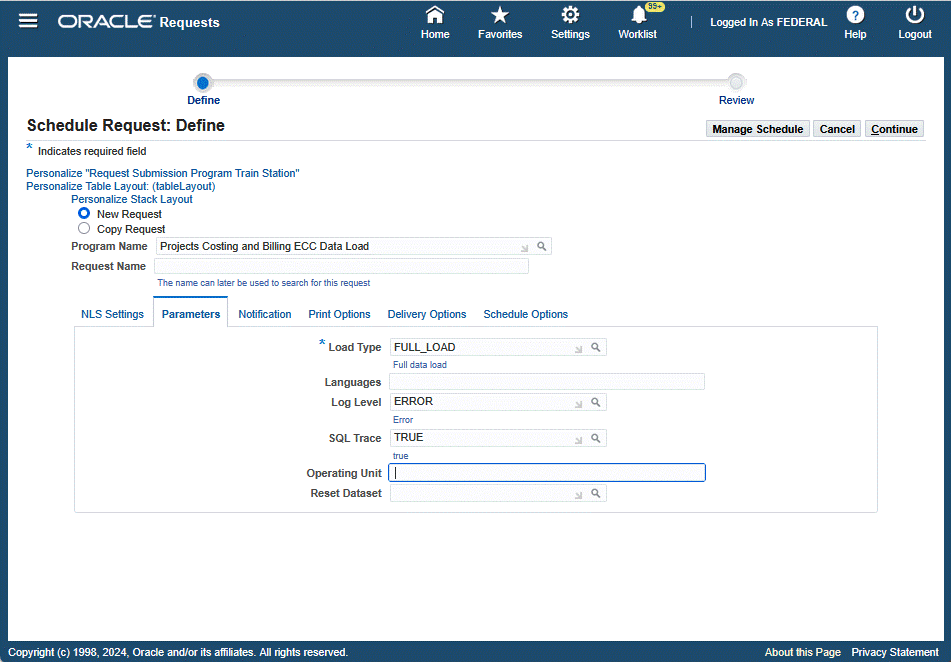
Click the Parameters tab.
-
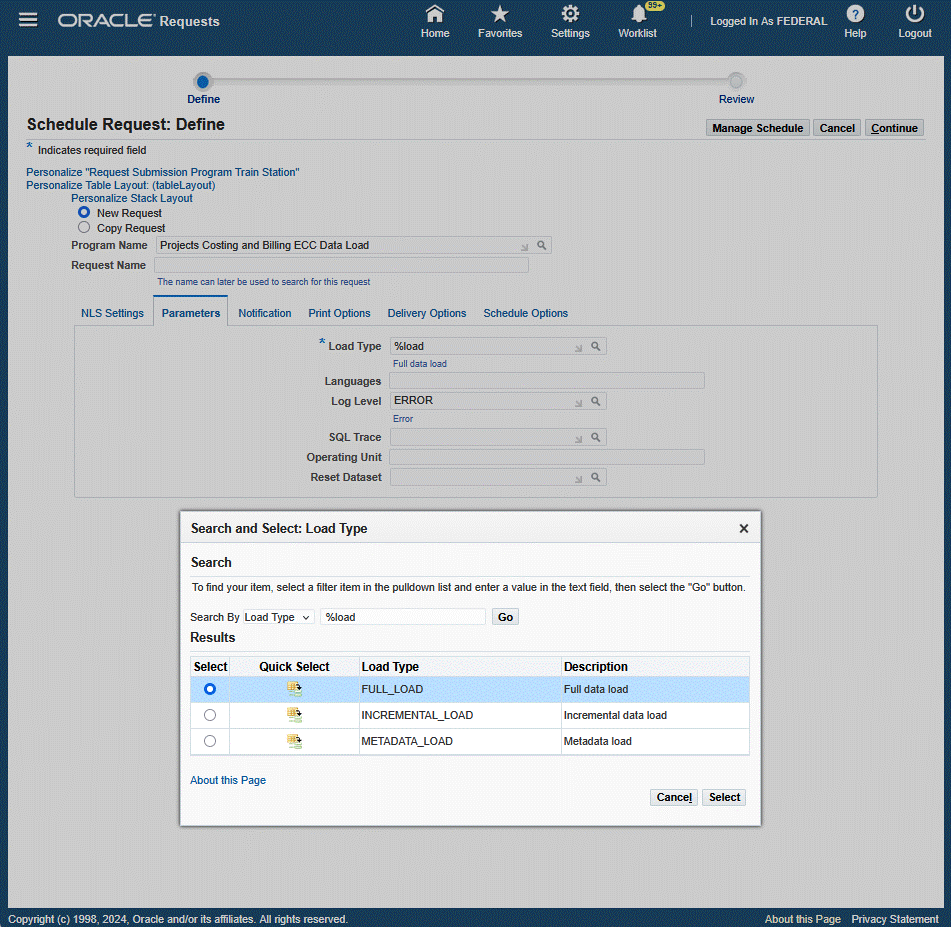
Select the appropriate Load Type:
-
Full Load: Loads all relevant Projects Command Center data specific to the concurrent program and is required for the first data load. If you select and run full load for subsequent requests, then this program clears all Projects Command Center data specific to the current program from ECC and loads fresh data.
-
Incremental Load: Loads the data modified and updated from the previous load only. Incremental load should be scheduled to run as often as required to keep the ECC dashboard current.
Note: Any of the following changes are not considered and included for incremental load:
-
PA/GL Period related changes (including period status)
-
Accounting statuses (any progress or rejection in the accounting program for a given transaction)
-
Any modification to an asset in Fixed Assets (Retirement of Asset)
-
Project related changes
-
Task related changes
-
New Task to existing Projects
-
New Budget lines to existing Project/Tasks
-
-
Metadata Load: Loads Descriptive Flexfield (DFF) metadata. If there are any changes to the DFF definition, then you must run the program first with the Metadata Load option and then the Full Load option so that the DFF changes are displayed in the command center.
-
Click Select.

-
-
Enter one or more language codes in the Languages field for the output. For multiple language codes, use the format AA,BB,NN. For example, enter US,AR,KO. If the field is blank, then the data will be loaded for the base language only (usually US).
-
Select the Log Level that you want the program to report. The default value is Error.
-
Select True to enable SQL trace. Otherwise, select False.
-
For the Projects Costing and Billing ECC Data Load program, you can enter an optional Operating Unit or a set of operating units for sequential data loading. This enables you to submit the program and process data for a specific operating unit, or for a set of operating units.
-
Select an optional value for Reset Dataset. You can extend the existing data set, or reset the entire data set.
-
Click Continue.

-
From the Schedule Request: Review page, click Submit. The request ID information displays.
-
Click OK to exit and close the page. The Requests page appears and displays all of your requests. You can click the Details icon to view your request details.
Business Rules and Validation
The Costing dashboard uses the following business rules and validations:
| Subject | Rule / Validation |
|---|---|
| Cost consideration for Capital Projects based on project setup to calculate CIP based on Raw cost or Burdened Cost | Based on the project setup for Capital projects to calculate CIP on raw cost and burdened cost, the dashboard displays the values accordingly for Metrics, Charts, and other components. For example, if the CIP Cost Type is 'Raw' for a project, then the ECC dashboard will use raw cost defined on the expenditure budget and vice versa. |
| Criteria in order for Projects or Tasks to be visible on the dashboard | All metrics and data consider only those transactions within three GL quarters. For a project or task to appear on the Costing dashboard, there should exist a minimum of one transaction against that project or task which is either created or updated within three GL quarters. |
| Recalculation / Adjustment on Transactions | When a transaction that is costed and accounted is marked for recalculation, the raw cost and burden cost on the transaction level is nullified, but the accounted information in GL is not nullified. For such cases, the dashboard represents metrics as described in the following table: |
| Date | Action | Uncosted Transactions | Total Expenditures | Unaccounted Expenditures Value | Accounted Expenditures (Projects) | Accounted Expenditures (SLA) | Accounted Expenditures (GL) |
| 20-Oct | n/a | 3 | 20000 | 4000 | 16000 | 16000 | 16000 |
| 21-Oct | EI XXX marked for Recalculation (Cost: 2000) | 4 | 2000 | 4000 | 16000 | 16000 | 16000 |
| 22-Oct | EI XXX cost Distributed (Cost: 2500) | 3 | 20500 | 4500 | 16000 | 16000 | 16000 |
| 23-Oct | EI XXX Accounting Events Generated | 3 | 20500 | 4000 | 16500 | 16000 | 16000 |
| 24-Oct | Accounting Complete | 3 | 20500 | 4000 | 16500 | 16500 | 16000 |
| 25-Oct | Post to GL | 3 | 20500 | 4000 | 16500 | 16500 | 16500 |
The overview results table (accounting related columns) retains old values unless the respective process is run. For example, the cost distribution process may change the PA or GL period, the debit account based on the run date of the concurrent program and the generate costing event program may change the credit account.
G-Invoicing Dashboard
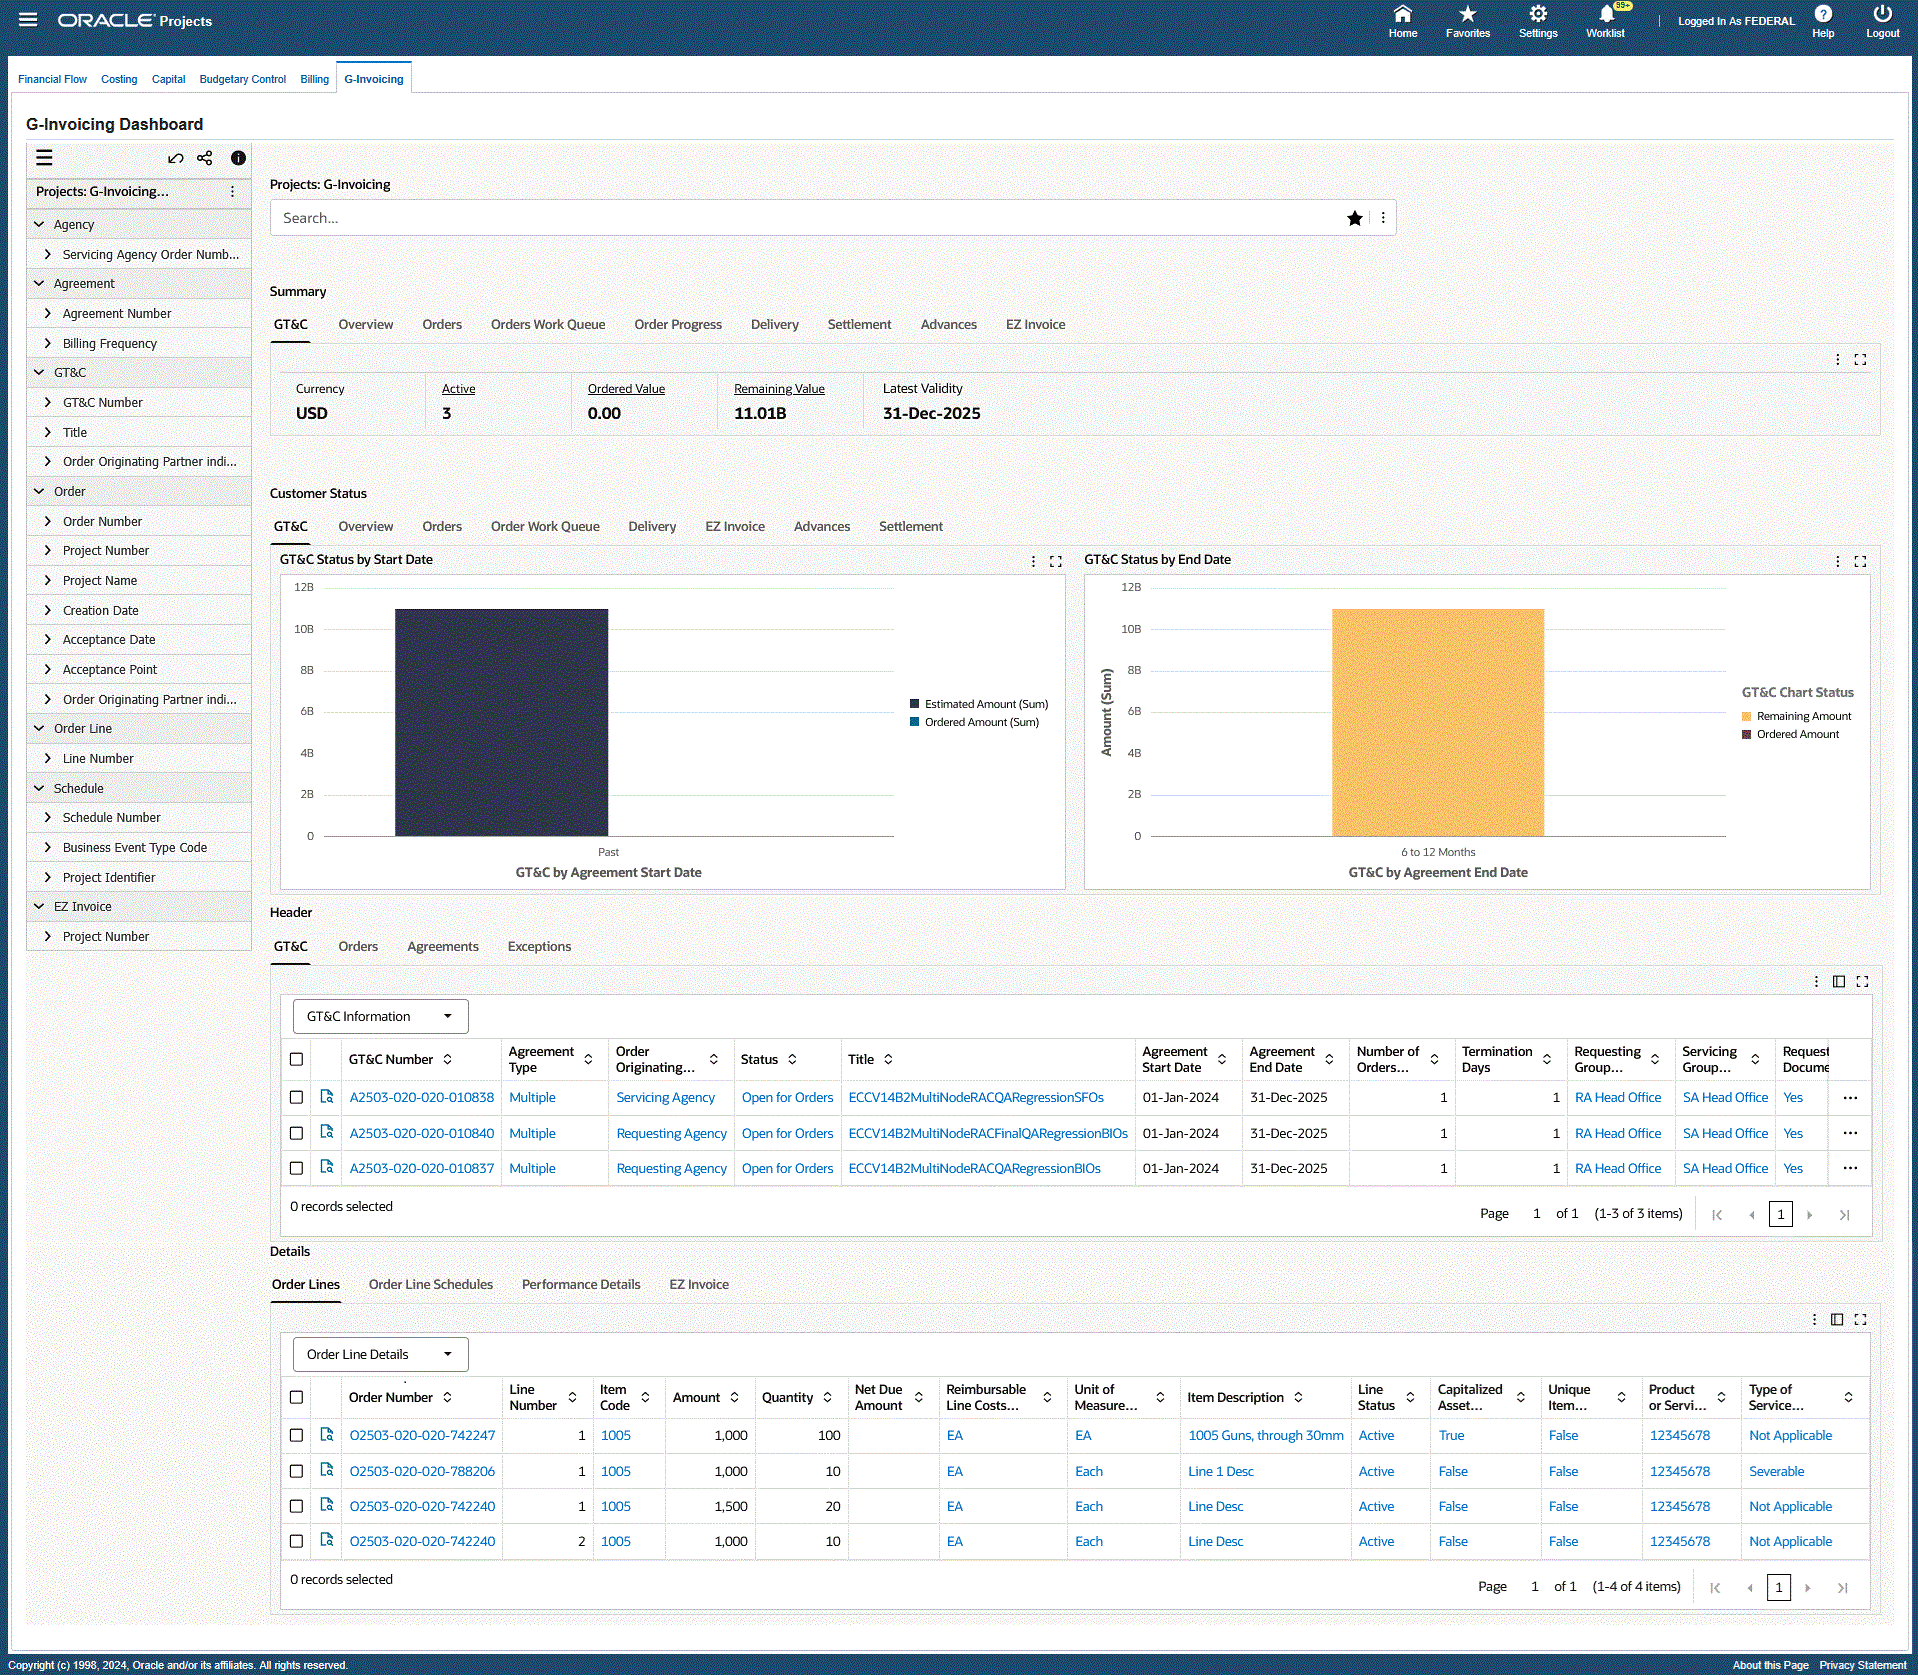
The G-Invoicing dashboard displays G-Invoicing data for all orders. The dashboard provides information to the servicing agency and key members for managing orders and displays G-Invoicing elements that include General Terms and Conditions (GT&Cs), overviews, order details, orders work queue, order deliveries, and EZ invoices metrics across all orders and projects. From the dashboard, you can navigate to individual projects, tasks, and resource assignment levels. Metrics on the dashboard are grouped into the following tabs on the dashboard:
-
GT&C
-
Overview
-
Orders
-
Orders Work Queue
-
Order Progress
-
Delivery
-
Settlement
-
Advances
-
EZ Invoice
Based on your Role Based Access Control (RBAC) setup, navigate to the Projects Command Center.
As an example, from the Projects SU, US Federal responsibility: Projects Command Center > G-Invoicing (tab)
The following table describes the G-Invoicing dashboard components.
G-Invoicing Dashboard

| Component | Description |
|---|---|
| Summary (tab layout) GT&C (tab) |
The GT&C summary bar displays the following metrics:
|
| Summary (tab layout) Overview (tab) |
The Overviews summary bar displays the following metrics:
|
| Summary (tab layout) Orders (tab) |
The Orders summary bar displays the following metrics:
|
| Summary (tab layout) Orders Work Queue (tab) |
The Orders Work Queue summary bar displays the following metrics:
|
| Summary (tab layout) Order Progress (tab) |
The Order Progress summary bar displays the following metrics:
|
| Summary (tab layout) Delivery (tab) |
The Delivery summary bar displays the following metrics:
|
| Summary (tab layout) Settlement (tab) |
The Settlement summary bar displays the following metrics:
|
| Summary (tab layout) Advances (tab) |
The Advances summary bar displays the following metrics:
|
| Summary EZ Invoice (tab) |
The EZ Invoice summary bar displays the following metrics:
|
| Customer Status (tab layout) GT&C (tab) |
The GT&C Status by Start Date chart displays buying agency details for total ordered amount and total estimated amount based on the active GT&C start date between the servicing agency and the buying agencies. Click on a requesting agency GT&C number in the chart to view the individual GT&C of the selected buying agency and its associated GT&C's with the servicing agency. Click on a Requesting Agency Location Code in the chart to refine the data and display all GT&C numbers that belong to the requesting agency. The GT&C Status by End Date chart displays buying agency details for total ordered amount and total remaining amount based on the GT&C end date between the servicing agency and the buying agencies. Click on a requesting agency GT&C number in the chart to view the individual GT&C of the selected buying agency and its associated GT&C's with the servicing agency. Click on a Requesting Agency Location Code in the chart to refine the data and display all GT&C numbers that belong to the requesting agency. |
| Customer Status (tab layout) Overview (tab) |
The Overall Status chart displays the order amounts based on the order completion date and status. The Activities in the Last 3 Periods chart displays orders for the prior three periods and includes:
Click on an order in the chart to refine the dashboard data. |
| Customer Status (tab layout) Orders (tab) |
The Open Orders by Agency chart displays the total value of orders for each order status against each buying agency with which the servicing agency is conducting business. You can click on an agency order number in the chart or the order value bar to view individual order details between the servicing agency and the buying agency. Click on a Requesting Agency in the chart to refine the data and display all Order Numbers that belong to that requesting agency. The Order by Status chart displays amounts based on the order start date and approval status. You can click on the Options (ellipses) icon and select dimension values to display order amounts by:
Click on a value in the chart to refine the dashboard data. |
| Customer Status (tab layout) Order Work Queue (tab) |
The Orders chart displays the internal status of orders and the total order amounts. You can click on the Options (ellipses) icon and select Group Dimension values to display order amounts by:
Click on a Work Queue Status value in the chart to refine the dashboard data. The Modifications chart displays the order modification flow with total order amount based on the Work Queue Status. You can click on the Options (ellipses) icon and select Group Dimension values to display order amounts by:
Click on a Work Queue Status value in the chart to refine the dashboard data. |
| Customer Status (tab layout) Delivery (tab) |
The Delivery Readiness chart displays orders and total order amounts based on order status. You can click on the Options (ellipses) icon and select Group Dimension values to display order amounts by:
The Delivery Status chart displays orders and total order amounts by completion dates. |
| Customer Status (tab layout) EZ Invoice (tab) |
The EZ Invoice chart displays the total amounts of EZ Invoices grouped by:
You can select dimensions to display total amounts for the following:
|
| Customer Status (tab layout) Advances (tab) |
The Advances chart displays displays the total open order amounts for advance-enabled orders, and displays amounts by the following Advance Status values:
|
| Customer Status (tab layout) Settlement (tab) |
The Settlement Adjustments chart displays the total value of Accepted Adjustments to the order performance by the requesting agency, and the total value of Delivery Adjustments by the servicing agency. The Settlement Status chart displays total Delivered Amount, Accepted Amount, and Settled Amount for each GL Period based on order performance. |
| Header (tab layout) GT&C (tab) |
The GT&C results table displays data grouped by GT&C attribute groups. You can view data grouped by:
You can click the Record Details icon within a selected row to open and view the General Terms & Conditions details window. You can also click on values in the GT&C Number, Title, Agreement Type, Status, Termination Days, Requesting Group Name, and Servicing Group Name columns to filter and refine dashboard data for the selected values. Click on the ellipses (…) icon in the row to open the following action items:
|
| Header (tab layout) Orders (tab) |
The Orders results table displays data grouped by Order attribute groups. You can view data grouped by:
You can click the Record Details icon within a selected row to open and view the Order details window. You can click on values in the columns to filter and refine dashboard data for the selected values. Note: This results table includes the following action-enabled attributes:
You can also click on the Options link in the table header to perform the following actions:
|
| Header (tab layout) Agreements (tab) |
The Agreements results tables displays all of the agreements related to GT&Cs which are EZ enabled. You can click the Record Details icon within a selected row to open and view the Agreement details window. You can also click on the Update Agreement action link within a selected row to open the Update Agreement window where you can view and update agreement details. |
| Header (tab layout) Exceptions (tab) |
The Exceptions results table displays all of the exceptions related to GT&Cs and orders that could not be pulled. It is not specific to EZ enabled GT&Cs. You can click the Record Details icon within a selected row to open and view the Exception details window. You can also click on a row level ellipses (…) icon and choose to Reject or Resync a selected exception. |
| Details (tab layout) Order Lines (tab) |
The Order Lines results table displays data grouped by Order Line attribute groups. From the drop-down list, you can select views to display details by:
Click on values in the columns to filter and refine dashboard data for the selected values. You can also click the Record Details icon within a selected row to open and view the Order Line details window. |
| Details (tab layout) Order Line Schedules (tab) |
The Order Line Schedules results table displays data grouped by Order Line Schedules attribute groups. From the drop-down list, you can select views to display details by:
You can click on values in the columns to filter and refine dashboard data for the selected values. Click on the Options ellipses icon link in the table header to perform the following actions:
You can also click on a row level ellipses (…) icon to:
You can also click the Record Details icon within a selected row to open and view the Order Line Schedule details window. |
| Details (tab layout) Performance Details (tab) |
The Performance Details results table displays data grouped by performance attribute groups. From the drop-down list, you can select views to display details by:
Click on the row level View action link to navigate to the View Performance History page to view performance detail. The page displays by Order Number, Order Line Number, Schedule Line Number, Performance Type, and Accounting Period. You can click on values within the columns to filter and refine dashboard data for the selected values. You can also click the Record Details icon within a selected row to open and view the Performance details window. |
| Details (tab layout) EZ Invoice (tab) |
The EZ Invoice results table displays EZ Invoice data. From the drop-down list, you can select views to display details by:
Click on the Update Additional Attributes action link to open the EZ Invoice Additional Attributes form for the selected EZ Invoice (row level). You can update many attributes for the EZ Invoice in this page. Click on the ellipses (…) icon in the table header for the following actions:
You can also click the Record Details icon within a selected row to open and view the EZ Invoice details window. |
Loading Projects Command Center Data
Before you can use G-Invoicing with EBS, you must retrieve and load the Projects G-Invoicing Enterprise Command Center (ECC) data. Perform the following steps:
-
From the Home page, select the Projects Super User responsibility.
-
Select Projects, then Requests, and then Run or Schedule.
The Submit Request window appears.
-
Query the concurrent , Projects G-Invoicing ECC Data Load.
The Parameters window appears.
-
Enter a value in the System Name field.
-
From the Load Type list, select either Full Load or Incremental Load.
-
Use a full load to load all existing data into Oracle Projects Enterprise Command Center.
-
Use an incremental load to load only data that has been modified since the previous run. To keep your ECC G-Invoicing dashboard current, you can schedule incremental loads to run as often as required.
-
-
Enter a value for the Language code field.
-
Select a value for the Log Level you want the program to report.
-
Select a value to set the SQL Trace On.
-
Click OK.
-
Click Submit to run the concurrent program.