7 Generating Oracle Database Firewall Reports
This chapter contains:
About Oracle Database Firewall Reports
From the Administration Console, you can produce Sarbanes-Oxley (SOX), Payment Card Industry (PCI), Data Protection Act (DPA), Gramm-Leach-Bliley Act (GLBA), and Health Insurance Portability and Accountability Act (HIPAA) reports. These reports are provided by default, giving full traceability of all essential information over a selected date and time range.
You can specify which of these reports are required for a protected database. To do so, display the Monitoring page in the Administration Console, click List in the Protected Databases menu, click the database name, and then select the required check boxes.
You can generate reports using the Reports menu in the Reporting tab. The reports can be displayed as a PDF document or Excel spreadsheet. If you schedule a report, Oracle Database Firewall enables you to e-mail the report to one or more recipients. You can schedule the report to be sent to e-mail recipients at specific times, for example, once a day. You can configure a reporting user account, which is only allowed to log in to the Management Server Administration Console and run reports. Other than this user, all valid Database Firewall system administrators can generate reports.
Generating Audit and Summary Reports
This section contains:
Generating Reports
This section contains:
Understanding the Reports Menu
There are two top-level report groups in the Reports menu (Reporting tab):
-
Audit reports: These are reports that include only the data included in a selected log search (see "Accessing the Traffic Log"). Audit reports are refreshed each time they are run.
-
Summary reports: These are reports that extract the required information from the traffic log while the report is being produced. Only "summarized" data is used. Automatic summarization of the traffic log data occurs every hour.
There are many more summary reports than audit reports. Reports can take longer to generate depending on the data included.
Depending on your navigation in the reports, the following options can be displayed in the Reports menu on the left side of the screen:
-
Main Group: Displays the top-level report group.
-
List: Displays the contents of the last group visited.
-
Add Group: Lets you add a report group
-
Add Report: Lets you add a custom report
-
Display Report: Displays the selected report
-
Retained: If applicable, displays retained reports of the currently-selected type.
-
Properties: Enables you to change the title or description of the report.
-
Scheduled Reports: Lists all scheduled reports that have been set up.
Generating a Report
To generate a report:
-
Log in to the standalone Database Firewall or Management Server Administration Console.
See "Logging in to the Administration Console" for more information.
-
Select the Reporting tab.
-
From the Reports menu, select List.
The Reports page displays the top-level set of report groups. Each group can contain reports and other groups. The Description column explains the types of report that the group contains.
-
If you have generated and retained this report before, the retained reports link is displayed. The link enables you to view or delete retained reports of that type.
-
If you want the most recent data to be made available for reporting purposes, click the Reporting tab, then the Summary reports link, and then click the Summarize Now button. This makes the data in the traffic log files available for reporting. Automatic summarizing takes place every hour.
-
Use the properties link to change the title or description of the report.
-
Click [up] to display the previous report group.
-
-
Drill down through the report groups until the report you want to produce is listed in the Reports column of the page.
The following screen shows the contents of the Audit Reports group.
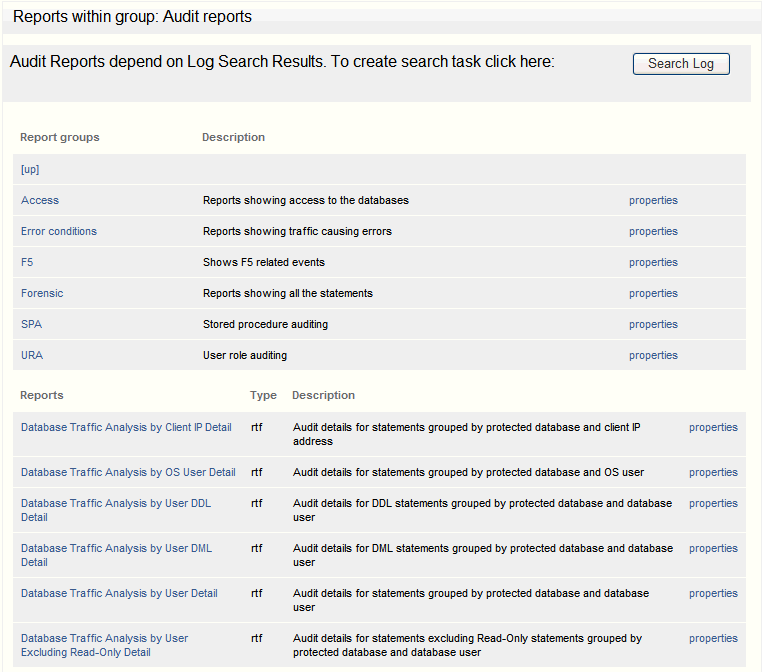
Description of the illustration reports_audit_group.gif
-
Click the name of the report in the Reports column.
For audit reports, select the log Search Results you want to use for the report.
-
The report is displayed.
The Oracle Database Firewall Management Server caches (that is, temporarily stores) the report. If you generate the report again within half an hour, the cached report is displayed.
The following four buttons are available on the page:
-
Retain: Retains a copy of the report on the Oracle Database Firewall Management Server. You can view or remove a retained report by clicking the retained reports link (see the preceding section). Retained reports are included in any configuration archives.
-
Schedule: Allows you to schedule the report to be created automatically at regular intervals (see "Scheduling Reports").
-
Show Report: Generates the initial report.
-
Update Report: Generates the report again with any new parameters you selected.
-
-
Select the report parameters:
-
The parameters are different depending on the report selected.
-
For all free form parameters, you can use POSIX extended regular expressions to define the parameters. Here are some examples:
-
eereturns any data containing the charactersee(Green, Lee, Feeney, etc.) -
^Steven$returns data with an exact match (Steven) -
Steven | Rogerreturns data containing either Steven or Roger
-
-
By default, the report is displayed as a PDF document. To generate the report in XLS format, select Microsoft Excel 2007 Worksheet (XLSX) from the Report format drop-down list, then click Update report. Clicking the <
report name>.xlsxlink in the bottom-left corner of the screen allows you to view or save the report, depending on your browser settings.
-
Reading a Report
The sample report below is an audit report generated in PDF format:
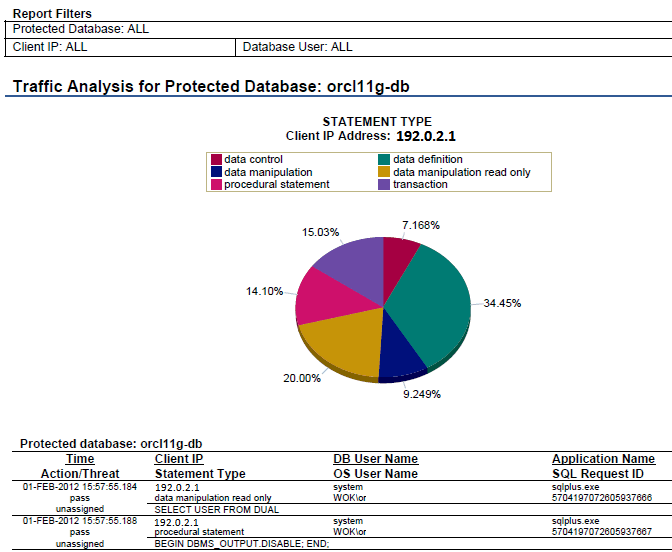
Report filters near the top of the report indicate the options selected when generating the report. Reports contain graphical representations of the data whenever possible. This may be a pie chart or a bar graph.
The graph is followed by data in tabular form. In this report, two-line column headings indicate that there are two or more pieces of information in each cell of the table. For example, in the above report row one contains:
-
Time, Action, and Threat level for a SQL statement in the first column
-
Client IP Address, the statement type, and the SQL statement in the second column
-
The database user name and the OS user name in the third column
-
The client application name and the SQL request ID in the fourth column
Finding a Report
This section describes the reports available in Oracle Database Firewall:
Audit Reports
Audit details provided for SQL statements in reports can include:
-
Date and time
-
Database Firewall action and threat level
-
Database user name
-
OS user name
-
Statement type (data definition, procedural, data manipulation, etc.)
-
Client application name and IP address
-
SQL request ID
-
Database Firewall cluster ID
The following audit reports are available:
Table 7-1 Audit Reports - Main Group
| Report | Description |
|---|---|
|
Database Traffic Analysis by IP Detail |
Audit details for statements grouped by protected database and client IP address |
|
Database Traffic Analysis by OS User Detail |
Audit details for statements grouped by protected database and OS user |
|
Traffic Analysis by User DDL Detail |
Audit details for DDL statements grouped by protected database and database user |
|
Traffic Analysis by User DML Detail |
Audit details for DML statements grouped by protected database and database user |
|
Database Traffic Analysis by User Detail |
Audit details for statements grouped by protected database and database user |
|
Traffic Analysis by User excluding Read-Only Detail |
Audit details for statements excluding Read-Only statements, grouped by protected database and database user |
Table 7-2 Audit Reports - Access
| Report | Description |
|---|---|
|
Failed Logins by User Detail |
Audit details for failed logins grouped by protected database and database user |
Table 7-3 Audit Reports - Error Conditions
| Report | Description |
|---|---|
|
Traffic Analysis by User Failed Statements |
Audit details for failed statements grouped by protected database and database user |
|
Traffic Analysis by User Invalid Statements |
Audit details for invalid statements grouped by protected database and database user |
| Report | Description |
|---|---|
|
F5 WAF Blocked Alert |
Alerts on SQL blocked by F5. When these occur, there is no SQL statement for Database Firewall to analyze. This report can help isolate or eliminate one reason for missing SQL. |
|
F5 Confirmed Alert |
F5 alerts confirmed as 'Out of Policy' by the Database Firewall |
|
F5 Incident Report |
List of all F5 alerts (incidents) by time |
|
No WAF Match |
Alerts from F5 not matched by any SQL traffic. There are several ways this may happen. For example, the SQL statement: was delayed and matching timed out, went to the database via another route, or was not issued by the application server. |
|
F5 Policy Conflict |
F5 Alerts that are 'In Policy' in the Database Firewall |
|
F5 Policy Conflict by User |
F5 Alerts that are 'In Policy' in the Database Firewall, grouped by user |
Table 7-5 Audit Reports - Forensic
| Report | Description |
|---|---|
|
Forensic Analysis grouped by Client IP |
Audit details for all statements grouped by protected database and client IP address |
| Report | Description |
|---|---|
|
SPA Pending Detail |
Detail of changes made to Stored Procedures, pending approval. This report can be very large since it contains the full content of each changed stored procedure. |
|
Summary of SPA Approved Summary |
Summary of approved changes made to Stored Procedures |
|
Summary of SPA Changes Pending Approval |
Summary of changes made to Stored Procedures pending approval |
| Report | Description |
|---|---|
|
Details of URA Changes Pending Approval |
Detail of changes made to User Roles pending approval |
|
Summary of URA Approved Changes |
Summary of approved changes made to User Roles |
|
Summary of URA Changes Pending Approval |
Summary of changes made to User Roles pending approval |
Summary Reports
Information provided for SQL statements in summary reports can include:
-
Date and time
-
Database Firewall action and threat level
-
Database user name
-
OS user name
-
Statement type (data definition, procedural, data manipulation, etc.)
-
Client application name and IP address
-
SQL request ID
-
Database Firewall cluster ID
The following summary reports are available:
Table 7-8 Summary Reports - DPA (Data Protection Act)
| Report | Description |
|---|---|
|
Data Access |
|
|
DPA Database Administration Activity |
Shows DDL and DCL statements by day for DPA protected databases |
|
Database Traffic Differential Audit |
Shows statements that are outside of policy for DPA protected databases. Shows a chart of statements by type: DDL or DCL. |
Table 7-9 Summary Reports - F5
| Report | Description |
|---|---|
|
F5 Incident Summary by Cluster |
Summary of F5 incidents grouping data by cluster |
|
F5 Incident Summary by User |
Summary of F5 incidents grouping data by user |
Table 7-10 Summary Reports - GLBA (Gramm-Leach-Bliley Act)
| Report | Description |
|---|---|
|
Data Access |
|
|
GLBA Database Administration Activity |
Shows DDL and DCL statements by day for GLBA protected databases |
|
GLBA Database Traffic Differential Audit |
Shows statements that are outside of policy for GLBA protected databases. Shows a chart of statements by type: DDL or DCL. |
Table 7-11 Summary Reports - General
| Report | Description |
|---|---|
|
Data Access |
|
|
Alerted Policy Anomalies by Client IP |
Summary of alerts grouped by client IP address |
|
Count of Clusters Grouped by DML Keyword |
Shows the occurrence of each DML keyword (INSERT, UPDATE, DELETE, MERGE) grouped by protected database per day |
|
Database Administration Activity |
Shows DDL and DCL statements by day for protected databases |
|
Database Traffic Analysis by Client IP |
Summary of database traffic grouped by client IP address and statement type |
|
Database Traffic Analysis by User |
Summary of database traffic grouped by database user and statement type |
|
Database Traffic Anomalies |
Summary of statements outside of policy by day |
|
Throughput Summary by Enforcement Point |
Shows all events categorized by Known or Anomaly (Unseen), and Action (block, warn, pass) |
|
Management |
|
|
Active Users |
Shows active users for protected databases during a specified time period |
|
Active Users Last Session |
Shows active users for protected databases during a specified time period, including last login time |
|
Active Users Last Session (spreadsheet format) |
Shows active users for protected databases during a specified time period, including last login time (optimized for spreadsheet format) |
|
Client Application Name List (spreadsheet format) |
Shows a list of all protected databases and the client applications that were used to access those databases (optimized for spreadsheet format) |
|
OS Users List (spreadsheet format) |
Shows a list of all protected databases and the OS users that accessed those databases (optimized for spreadsheet format) |
|
Session Summary by IP Address |
Shows a list of Distinct DB User, OS User and Client Application Name by IP Address and Protected Database |
|
Session Summary by IP Address (spreadsheet format) |
Shows a list of Distinct DB User, OS User and Client Application Name by IP Address and Protected Database (optimized for spreadsheet format) |
|
Summary of Client IP Address by Protected Database (spreadsheet format) |
Shows a list of all client IP addresses used to access each protected database |
|
Summary of Database Users by Protected Database (spreadsheet format) |
Shows a list of all database users who have accessed each protected database |
|
System Group |
|
|
System Administration |
Shows System Administration activity on the Oracle Database Firewall Management Server |
Table 7-12 Summary Reports - HIPAA (Health Insurance Portability and Accountability Act)
| Report | Description |
|---|---|
|
Data Access |
|
|
HIPAA Database Administration Activity |
Shows DDL and DCL statements by day for HIPAA protected databases |
|
HIPAA Database Traffic Differential Audit |
Shows statements that are outside of policy for HIPAA protected databases. Shows a chart of statements by type: DDL or DCL. |
Table 7-13 Summary Reports - PCI (Payment Card Industry)
| Report | Description |
|---|---|
|
Data Access |
|
|
PCI Database Administration Activity |
Shows DDL and DCL statements by day for PCI protected databases |
|
PCI Database Traffic Differential Audit |
Shows statements that are outside of policy for PCI protected databases. Shows a chart of statements by type: DDL or DCL. |
|
Management |
|
|
PCI Active Users |
Shows active users for PCI protected databases during a specified time period, including last login time |
Table 7-14 Summary Reports - SOX (Sarbanes-Oxley)
| Report | Description |
|---|---|
|
Data Access |
|
|
SOX Database Administration Activity |
Shows DDL and DCL statements by day for SOX protected databases |
|
SOX Database Traffic Differential Audit |
Shows statements that are outside of policy for SOX protected databases |
|
Management |
|
|
SOX Active Users |
Shows active users for SOX protected databases during specified time period, including last login time |
Adding Your Own Reports
You can add your own custom reports using Oracle Database Firewall and Oracle BI Publisher included with the Database Firewall installation. You will need a data definition file (XML format) and a report template (RTF or XLS format). This section describes how to extract these files from an existing Database Firewall report and use them for your own report. You will need to refer to Oracle Business Intelligence Publisher documentation for how to customize the report template.
Note:
Oracle Business Intelligence Publisher is embedded within Database Firewall to run reports. You can modify the layout of existing reports by downloading the report template available for each report. However, in order to add your own custom reports, you must have a Full Use license for Oracle Business Intelligence Publisher.To add a report starting from existing data definition and template files:
-
Click the Reporting tab.
-
Drill down to an existing report, and click its properties link.
-
At the bottom of the properties page, right-click the Report Data Definition and Report Template links to save both files on your computer.
-
Customize the data definition file (an XML file) as necessary. (You will customize the report template later.)
-
Click the Reporting tab, then click a report group (such as Summary Reports), or drill down through the groups until you get to a group where you want to add a new report.
-
In the Reports menu on the left, click Add Report, enter a title and optional description, and then click Add.
-
Click the upload link for the Report Data Definition, and upload your data definition file into the new report.
-
To generate sample data to use for customizing the report template, in the Reports menu on the left, click Display Report, and then click Generate Sample Data.
Sample data for the new report is generated based on the data definition file you uploaded. A link to the sample data file appears at the bottom of the page.
-
In the new report, right-click the sample data file link and save it to your computer.
-
Use Oracle BI Publisher to customize the report template you downloaded from an existing report, using the sample data you generated in the new report.
Refer to Oracle BI Publisher documentation available from this page:
http://www.oracle.com/technetwork/documentation/index.html. -
To upload the custom report template into the new report, locate it in the report list in Database Firewall, and then click its properties link.
-
Click the upload link for the Report Template, upload the template, and then click Save.
Scheduling Reports
A scheduled report is an audit or summary report that is generated automatically at a specified time. Optionally, the report can be set up to run automatically every hour, day, week, etc. A scheduled report is sent as a PDF document or Excel spreadsheet to specified e-mail addresses. The settings can be different for each report you set up.
To schedule a report:
-
Log in to the standalone Database Firewall or Management Server Administration Console.
See "Logging in to the Administration Console" for more information.
-
Select the System tab.
-
Select Email Configuration to ensure that the SMTP e-mail settings are configured.
See Oracle Database Firewall Administration Guide for more information about configuring the system settings.
-
Generate the required report, as described previously. See "Generating Audit and Summary Reports" for details of how to do this.
-
Select the report parameters, including the report period and the format of the report.
-
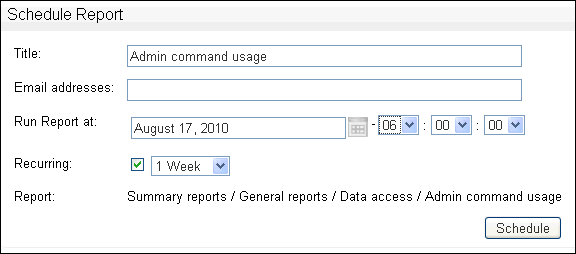
Click the Schedule button displayed at the top of the report. The following page is displayed.
-
Complete all fields, and click Schedule.
You must enter at least one email address. Separate several email addresses with spaces.
The Title is displayed in the list of scheduled reports that are set up and in the title of the report e-mail. The report will now automatically run according to the defined schedule.
-
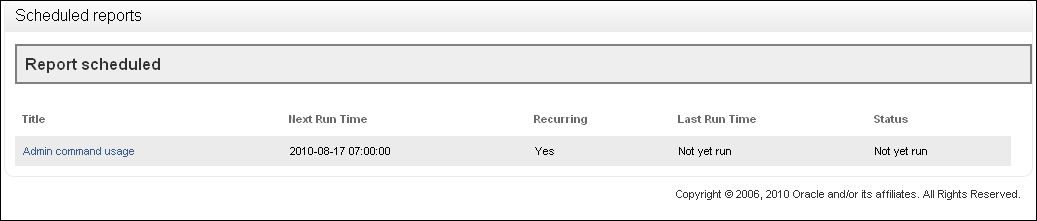
You can display a list of scheduled reports that have been set up by selecting Scheduled Reports in the Reports menu. For example:
-
Clicking the name of a report allows you to delete or edit the report schedule.
How the Security Index Formula Is Calculated
For reports that display a security index, the index is calculated as follows:
Security Index = Σ (Threat severity (cid) x Frequency (cid) ) / 5
In this specification:
-
Threat severity is the threat severity of the cluster ID, as set in the Analyzer (range 0 to 5).
-
cid is the cluster ID. All clusters that occur over the specified time period are included in the calculation.
-
Frequency is the percentage of all statements recorded over the specified period that match the cluster.