4 Monitoring Rules and Policies
This chapter discusses the types of monitoring rules and how the software uses monitoring rules and policies to generate alerts and incidents in the user interface.
The following information is included:
4.1 Introduction to Monitoring
Monitoring detects components or attributes of a managed resource that are not operating within specified parameters. Resource is a generic term for an asset (such as hardware or operating system), a group, a network, or a library that is managed by Oracle Enterprise Manager Ops Center.
Monitoring rules and policies define the monitoring parameters and are the main components of a complete monitoring configuration. They are defined as follows:
-
Monitoring Rules: Define alerting conditions. You can apply one or more rules to an asset to monitor the asset and raise an alert when the an asset is operating outside the defined parameter.
-
Monitoring Policies: A set of monitoring rules targeted to a specific asset type. Default monitoring policies contain a set of rules that are automatically applied to monitored resources. You can create your own policies and define the rules for the policy.
Monitoring typically uses the Agent Controller to gather information. When an operating system is an agentless managed system, the software monitors it remotely.
4.2 Roles for Monitoring
Table 4-1 lists the roles required to complete monitoring tasks. You can restrict privileges to specific targets or groups of targets. Contact your administrator if you do not have the necessary role or privilege to complete a task. See the Oracle Enterprise Manager Ops Center Administration Guide for information about the different roles and the permissions they grant.
Table 4-1 Monitoring Tasks and Roles
| Task | Role |
|---|---|
|
View a monitoring rule |
Read Policy / Plan Administrator |
|
View a monitoring policy |
Read Policy / Plan Administrator |
|
View the association of an asset and a monitoring policy |
Read Asset Administrator Policy / Plan Administrator |
|
View the historical data of a threshold rule |
Read Asset Administrator |
|
Create, edit, or delete a monitoring rule |
Fault Administrator |
|
Create, copy, extract, edit, and apply a monitoring policy |
Policy / Plan Administrator |
|
Modify the monitoring configuration of an asset |
Fault Administrator |
|
Delete a monitoring policy |
Policy / Plan Administrator |
|
Group assets by a monitoring policy |
Asset Administrator |
|
Apply a monitoring policy to an asset |
Fault Administrator |
|
Apply a monitoring policy to a group |
Asset Administrator and Fault Administrator |
4.3 Actions for Monitoring Rules and Policies
You can perform the following actions, depending on the type of rules, the requirements, and your roles:
-
Create, edit or delete a monitoring rule.
-
Create, copy, extract, edit, apply, or delete a monitoring policy.
-
Modify the monitoring configuration for an asset.
-
Group assets by a monitoring policy.
-
Apply a monitoring policy to an asset or a group.
4.4 Location of Monitoring Rules and Policies in the User Interface
Table 4-2 Location of Monitoring Rules and Policies in the UI
| Object | Location |
|---|---|
|
Monitoring policies |
Expand Plan Management in the Navigation pane, then click Monitoring Policies. |
|
Monitoring rules |
Expand Plan Management in the Navigation pane, then click Monitoring Policies. Open a policy to see the rules. |
|
Asset-specific monitoring rules |
Select an asset from the Asset view, then click the Monitoring tab. |
4.5 Monitoring Rules
Monitoring rules state the values and boundaries for an asset's activity. A monitoring policy is a set of rules. When you apply monitoring policy to all the assets, it enforces consistency in monitoring. Each monitoring policy contains rules for threshold levels. Default policies for monitoring hardware, operating systems, and Oracle Solaris Clusters are included in the software. You can use the default policies, but you cannot edit them. To edit or add monitoring rules to a monitoring policy, you must make a copy.
Monitoring rules define the alerting conditions. Rules are associated with, and determined by, the type of managed resource. You can apply a generic monitoring rule to many different attributes, but other monitoring rules are attribute-specific, hard-coded into drivers and cannot be relocated or reconfigured.
When you set a threshold, the UI displays the existing historical data for an attribute. The software might propose some default threshold values based on the analysis of historical data, and display existing thresholds as a bar on that historical data. You can enter any threshold value.
Each managed resource has a Monitoring tab. You can add, edit, enable, disable, and remove resource monitoring rules. You can tune the rules for a specific managed resource.
Note:
Tuning rules for a specific managed resource detaches the resource from the monitoring policy, keeping only a copy of the rules. When you modify rules in the policy, the change is not made to the rules that are associated with the resource.Rules have Info, Warning, and Critical severity levels. Default values and severity levels are provided at installation, but you can edit the rules for your organization. For user-defined rules, you can define the time between when the alerting condition occurs and when the software generates an alert or incident. You can configure the software to send an e-mail or pager message when it identifies a Warning or Critical incident.
You can view rules for a specific asset or a specific policy from different places in the UI, as follows:
-
Asset View: Rules for a specific asset are located in the Monitoring tab for the asset. To display the tab, click the asset in the Assets navigation tree, then scroll over to the Monitoring tab in the center pane. The name of the monitoring policy applied to the asset appears at the top of the monitoring rule grid, next to the number of rules.
-
Policy View: Rules for a specific policy are located under Monitoring Policies in the Operational Plans section of the Plan Management tree.
The following categories of monitoring rules are available:
-
System-defined rules: These are attribute- specific and are hard-coded into drivers. You can disable a system-defined rule, but you cannot edit, relocate, or reconfigure these types of rules.
-
User-defined rules: These are associated with, and determined by, the type of managed resource. You can apply a user-defined rule to many different attributes.
4.5.1 User-Defined Rule Parameters
The following types of editable user-defined rule parameters, also known as rule types, are available:
-
Threshold: Sets an upper or lower monitoring threshold for the monitored attribute.
-
Boolean Control: Sets a logical operator of true or false for the monitored attribute.
-
Enumerated Control: A series of values that defines a subset of specific values among the possible values of the monitored attribute. An alert occurs when the attribute matches one of those specific values.
-
Expression: Defines the variables, literals, and operators for an attribute. An expression is an instruction to execute something that returns a value.
You cannot modify all rules, but most rules include some parameters that you can tune, or edit, to meet your organization's requirements.
The following are some examples of editable parameters:
-
Severity level of the alert: You can define the parameters for informational, warning, and critical alerts.
-
Raising and clearing values: These are threshold settings that determine when an alert is raised and cleared. These two values are always the same. For example, you can configure the software to raise an alert when a value reaches 90% and clear the alert when the value falls below 90%.
-
Monitor for alert limits at specific time: Defines when you want monitoring to occur, or to not occur. You might use this parameter when a daily maintenance procedure causes an attribute to operate outside of the normal monitoring threshold, but you do not want to raise an alert. You can define a period of time when the monitors are disabled and you can perform maintenance.
-
Generate alert after: Defines how long an issue occurs before an alert is generated. The number defines the time between when a threshold is exceeded and when an alert is generated. The alert is not triggered immediately. An alert is generated when the monitored attribute value is outside the threshold after the specified delay. You might use this parameter to limit false positive alerts due to a temporary condition.
4.5.2 Enabled and Active Rules
Monitoring rules have two types of states:
-
Enabled or Disabled: Disabling a rule removes that attribute from monitoring. You can disable and enable rules on a per asset or group basis.
-
Active or Inactive: Reflects the system's state and indicates whether the software is monitoring the asset or group. When a rule is not enabled, monitoring is not active.
By default, all monitoring rules are enabled. The status appears on the Alert Monitoring Rules page, which you can access from the Monitoring tab. When Yes is in the Enabled and Active fields, the rule is enabled and active. When No appears in the corresponding field, a rule is disabled or inactive. Figure 4-1 shows the Service Alert Monitor status as enabled, but inactive.
Figure 4-1 Enabled and Active Monitoring Rules
Description of "Figure 4-1 Enabled and Active Monitoring Rules"
An Enabled field appears in the list of monitoring rules for an asset. You can disable one or more rules for a specific asset. When No appears in the Enabled column, the rule is disabled.
When a rule is enabled, the active state reflects the system's actual state and indicates whether the software is using the rule. The following are some reasons that an enabled rule might be inactive:
-
When a specific attribute is not hard-coded into the driver, monitoring is not possible for that attribute.
-
The software cannot reach the resource or the attribute cannot be refreshed.
-
Some type of misconfiguration, such as a missing mandatory parameter or an illegal value for a parameter.
-
An internal error specific to the monitor, particularly for driver-specific monitors.
You can view the rules for a specific asset or you can view the rules for a policy that is associated with one or more assets.
4.5.3 Editing Monitoring Rules
Monitoring rules have pre-defined parameters. You can change the parameters, including the threshold values and the monitoring level, to meet your data center guidelines. You can define the parameters for an individual asset or for a group of assets.
You can create separate monitoring groups to consistently and efficiently define the parameters for all systems in each group. For example, you can create a group for a set of high priority systems. You edit one set of specific threshold values for all members of that group and apply a monitoring policy to the group. All members of the group are now monitored in the same way for the same values.
You can edit a monitoring rule for a specific asset or the monitoring rule for a monitoring policy. Editing the monitoring rule parameters for an individual system might be useful when a particular system is on a critical path. For example, you might consider the systems that you have the Enterprise Controller and Proxy Controllers on critical path systems, you can monitor the system continuously and create more stringent monitoring thresholds for those systems.
Note:
When you update a monitoring rule in a policy, the monitoring configuration of all assets that are associated with the policy are updated to reflect the revised rule.You can perform the following tasks:
-
Change the values for the Warning and Critical thresholds
-
Change file system thresholds
-
Change the thresholds by system or by group
-
Set specific threshold values for different operating systems
For example, you can create a threshold on the Enterprise Controller system that sends a warning when the file system use exceeds 90%. This alerts you when the Enterprise Controller file system is almost full.
For a threshold alert, you can change how often and for how long the software monitors the resource. You can change the threshold values.
-
Alert window: Enables you to specify a period of the day when the monitoring rule is enabled. For example, when a daily maintenance operation causes a monitored attribute to exceed a threshold, you can exclude monitoring for that time to disable monitoring for that maintenance window.
-
Generate alert after: Enables you to configure monitoring to ignore a monitored attribute that is outside the defined monitoring parameters for a short period of time. Specifying a delay means that the software generates an alert only when the value remains above the specified limit for a given duration. The software does not generate an alert when the value goes above the limit once and then immediately goes back to normal.
Perform the following steps to edit a monitoring rule:
-
Determine whether to edit a rule for a policy or for an individual asset:
-
For a policy: From the Plan Management section of the Navigation pane, click Monitoring Policies, then click a policy.
-
For an asset: From the Assets section of the Navigation pane, select an asset, then click the Monitoring tab.
-
-
Click the Edit Alert Monitoring Rule Parameters icon.
-
Click the entry in the Value column and type the new value. For a threshold alert, you can change how often and for how long the value is monitored, and you can change the threshold values.
-
Click Apply to submit the changes.
See Appendix A, "Asset Attributes" for more about the attributes that you can use in monitoring rules.
4.5.4 Using Historical Data to Determine Threshold Limits for a Specific Asset
The software maintains a history of each monitored asset's performance against its assigned threshold rules. When you add a new threshold-type monitoring rule or modify a threshold configuration for a specific asset, it does not impact the asset's attribute history.
The asset's attribute history, which is maintained by the software, is not specifically tied to the threshold rules. Oracle Enterprise Manager Ops Center only records statistical values of the asset attributes over time. However, the threshold wizard can leverage the history to suggest meaningful threshold values. When there is historical data for the monitored attribute, a graphical representation of the historical data appears along with a proposed default threshold value based on the analysis of the data.
When modifying a threshold configuration for a specific asset, you can choose the time frame from a list of options, from one day up to six months, to display a graphical representation of the historical data. You can use this information to tune the threshold rules.
Note:
When you edit the threshold limit for a specific asset, the software disassociates the asset from the default monitoring policy and creates a new monitoring policy for the asset.4.5.5 Adding Monitoring Rules
Each monitoring policy contains a default set of rules. See Monitoring Policies for information on policies. The rule set and default parameters depend on the managed asset subtype. See Monitoring Rules for a definition of type.
When specifying an Expression monitoring rule, you use the Oracle Enterprise Manager Ops Center query language to write a logical expression that defines the alerting condition for one or more resource attributes. The logical expression includes attribute names, operators, and literal values. You can use a dotted notation to reference attribute subfields.
When adding a Threshold, Enumerated, or Boolean monitoring rule, you must define the monitored attribute. When adding an Expression rule type, specify an expression that references one or more attributes to monitor. The following are some examples of monitored attributes:
-
CpuUsage.usagePercentage -
ProcessUsage.topMemoryProcesses.pid=*.physicalMemoryUsage -
DiskUsageSet.name=*.busyPercentage.
Monitored attributes are available in the Javadoc that is in the Oracle Enterprise Manager Ops Center Software Developer's Kit (SDK). Go to the dvd/platform/Product/components/packages directory and install the SUNWxvmoc-sdk.pkg package.
Browse the available attributes and names for the monitoring framework. Attributes always start with an upper case letter, such as SystemUpTime, and fields always start with a lower-case letter.
For example, when you want to list the valid monitored attributes for an operating system, go to the com.sun.hss.type.os.OperatingSystem Javadoc page. This page displays all of the attributes of an OperatingSystem
Each of these attributes is either a simple type, a structure or struct-like type, or a collection type. The following are examples of the different types of attributes:
-
Struct-like: You can drill-down into a field of the structure type. The fields always start with a lower-case letter, such as
SystemLoad.average1Minute -
Collection: You can drill-down into a member of the collection. For Maps you do this by specifying the appropriate 'key'. When you set the key, specify the value for the 'name' field, to get the value of a single member. For example, use the following to check the 'enabled' value of the interface named eth0:
InterfaceInfos.name=eth0.enabled
Note:
Structures are sometimes nested. For example, a struct-like attribute can contain another struct-like field, or a collection. Collections typically contain struct-like values. To drill down, continue to append the appropriate field names.You can perform a query which scans across all members of a collection by specifying the '*' wildcard value for the key or name. When you perform a query, you must use one of the following operators: max, min, or like. For the query syntax, see the DomainQuery Java class Javadoc. See Appendix A, "Asset Attributes" for details on the Javadocs.
See Appendix G, "Expression Query Language" for more information on the query language, grammar, lexical elements, and method details.
4.6 Monitoring Policies
A monitoring policy contains the information needed to monitor a managed asset with user-defined alert configurations, including defined thresholds and alert monitors.
A policy is for a specific type of resource, such as operating systems. A more specific policy might apply to a subset of operating systems, such as all Oracle Solaris operating systems. Each monitoring policy contains a number of alert monitors for a specific type of resource. Alert monitors watch the state of managed resources and their attributes and raise an alert when the state is outside the pre-defined thresholds.
Each Monitoring policy contains a default set of rules. The default rule set and parameters depend on the managed asset subtype. You can apply any monitoring policy to a managed asset or group of assets to change the monitoring configuration on the subset of those resources of a compatible type.
For example, you can highlight a Oracle Solaris operating system and extract a monitoring policy for an operating system. You can specify one of the following as the OS subtype for the new policy:
-
Oracle Solaris 10: Any supported Oracle Solaris 10 operating system.
-
Oracle Solaris 10 Operating System: Any supported Oracle Solaris operating system, beginning with Oracle Solaris10 8/07 (update 4). You might use this subtype when you use the Oracle Solaris Zones policy.
-
Oracle Solaris: Any supported Oracle Solaris operating system release.
-
Operating System: Any supported Oracle Solaris, Linux, or Windows operating system.
You can use the following methods to create a policy:
-
Create a new policy, then edit the policy to add rules
-
Copy an existing policy and then edit it, as needed, to modify the rules
-
Extract an existing policy from an asset and modify it.
You can view a policy from the asset view or the policy view. The asset view is
Extracting a Monitoring Policy is similar to copying a policy. You perform the copy policy action from the policy view and the extract policy action from the asset view. By extracting a policy from the asset view, you ensure that the subtypes are valid for that asset type. You can change the target subtype to a more specific or a more generic eligible target type. To be eligible, the policy must be a member of a more general policy for the specified target.
4.6.1 Default Monitoring Policies
When you discover and add an asset, the software applies the default monitoring policy for the asset's type immediately.
Some monitoring policies install probes or agents on managed resources, while other policies are designed to invoke arbitrary actions or scripts against the managed resource.
4.6.2 Available Monitoring Policies
A monitoring policy is a collection of rules that are associated with each type of monitored asset. The policy defines the resources monitored and the rules for that asset type. You can add and edit policies and select the default policy for a specific asset type.
Go to the Plan Management section of the UI for a list of available monitoring policies. Click Monitoring Policies to display a list of all policies, the default status of the policy, and the intended asset or target type. The following types of monitoring policies are available:
-
User-Defined Policies: Typically use generic rules and contain monitoring thresholds. A Operating System policy is an example of a user-defined policy that monitors the following generic operating system parameters: CPU usage, disk IO queue length and utilization percentage, file system usage, memory usage, network bandwidth utilization, and swap usage, and system load.
-
System Defined Policies: A system-defined policy is read-only, you cannot disable or modify the rules defined in the policy. Typically use asset specific rules. The monitored details are determined by what is implemented on the specific asset. An example of a system-defined policy is the MSeriesChassis policy that monitors the Xsb Mode of a SPARC M-series chassis. The naming convention for system-defined policies is that the name always begins with the letters OC.
You cannot configure this type of rule, you can only turn the rule off and on.
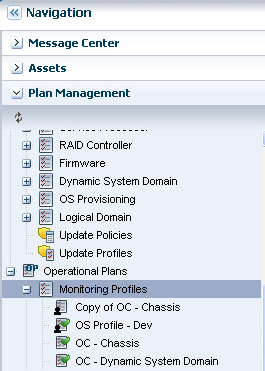
The Navigation pane and center pane both display user-defined policies followed by system-defined policies. The icons and naming convention help to identify the type of policy in the Navigation pane. All system-defined profiles use the prefix OC. For example, in Figure 4-2 Copy of OC - Chassis and OS Profile - Dev are user-defined profiles and OC - Chassis is a system-defined profile. The policies appear in different sections in the center pane.
4.6.3 Monitoring Policy Details
Each asset has a Monitoring tab. The tab displays monitoring configuration details, such as the associated monitoring policy.
When an asset is managed, the software automatically assigns a default monitoring policy to the asset. The name of the associated monitoring policy appears above the Monitoring Rules table. The field is empty when an asset is not associated with a policy. If you associate the asset with a user-defined monitoring policy and then later delete that policy, the asset might not have an associated monitoring policy.
Monitoring policy details vary, depending on the asset and associated resources being monitored. Figure 4-3 is an example of a system-defined operating system monitoring policy, including the Policy Details. The Details section of the page contains information about the policy, including the name, description, and the type of policy. The policy details also describes the applicable types of assets or targets, whether the policy is a sub-type of another policy, when the policy was last modified, and whether the policy is the default policy for the target types.
Figure 4-3 System-Defined Operating System Monitoring Policy
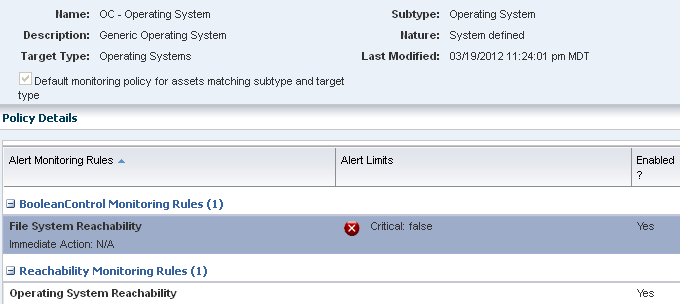
Description of "Figure 4-3 System-Defined Operating System Monitoring Policy"
The following system-defined and generic monitoring policies are available:
-
OC – CiscoSwitch: Monitors an Ethernet switch's power status, switch port status, and switch status.
-
OC – Dynamic System Domain: Monitors the state and status of the dynamic system domains on eligible servers. Server reachability is monitored. Informational alerts are available for the power state, either on or off, and the operating system state, either running or not. The Server Port Status generates a Warning alert when the server port is disabled or down.
-
OC – File Server: Monitors the file server reachability, backing devices usage percentage, storage allocation percentage, and storage usage percentage of generic file servers.
-
OC – Global Zone: Monitors the DHCP status, appliance health, CPU usage, disk IO, file system usage, memory usage, network bandwidth, Swap usage, and system load of a global zone.
-
OC – ISCSI Storage Array: Monitors the iSCSI storage array reachability, storage allocation percentage, storage usage percentage, volume group allocated space percentage, and volume group used space percentage.
-
OC – Local Library: Monitors the storage library usage percentage for a local storage library.
-
OC – Logical Domain: Monitors Oracle VM Server for SPARC guest status, including the migration status, running or not, and whether the guest is powered on.
-
OC – M-Series: Monitors the Xsb Mode of a SPARC M-series chassis
-
OC – NAS Library: Monitors the storage library status and storage library usage percentage of network attached storage (NAS) libraries.
-
OC – Non-global Zone: Monitors CPU usage, disk IO queue length and utilization percentage, memory usage, network bandwidth utilization, and swap usage for non-global zones.
-
OC – Operating System: Monitors the following generic operating system parameters: CPU usage, disk IO queue length and utilization percentage, file system usage, memory usage, network bandwidth utilization, and swap usage, and system load.
-
OC – Oracle VM Server for SPARC: Monitors Oracle VM Server for SPARC status, including the DHCP client, appliance health, and free virtual CPU (VCPU) usage.
-
OC – Oracle VM Server for x86: Monitors Oracle VM Server for x86 status, including the DHCP client, appliance health, and free virtual CPU (VCPU) usage.
-
OC - Power Distribution Unit: Monitors Ampere levels of rack Power Distribution Units.
-
OC – Remote Oracle Engineered System: monitors remote Oracle engineered systems.
-
OC – SAN Library: Monitors the status of the storage area network (SAN) libraries.
-
OC – SAN Storage Array: Monitors the SAN storage array reachability and usage. The usage includes the storage allocation percentage, storage usage percentage, volume group allocated percentage, and volume group used space percentage.
-
OC – Server: Monitors the following parameters on a generic server: Power status, server port status, CPU, NIC, fan, fan tray, memory, and power supply.
-
OC – Server Pool: Monitors the total CPU allocation percentage, total cryptographic units allocation percentage, and the total memory usage percentage.
-
OC – Solaris Cluster: Monitors the Oracle Solaris cluster install mode, reachability, and monitor.
-
OC – Solaris Cluster Node: Monitors the online status, scalert.node reachability, and scalert.node alert monitor.
-
OC – Solaris Cluster Zone Cluster Group: Monitors the scalert.zone cluster alert monitor.
-
OC – Solaris Cluster Zone Cluster Node: Monitors the scalert.zone Cluster Node Alert Monitor
-
OC – Storage: Monitors the following parameters for a generic storage device: operating system status, power status, server port status, and storage alert.
-
OC – Switch: Monitors an Ethernet switch's power status, switch port status, and switch status.
-
OC – Virtual Machine: Monitors the reachability of the virtual machine, if the operating system is running, and the migration status of a virtual machine.
4.6.4 Applying a Monitoring Policy to a Group
You can apply, or associate, a monitoring policy with a user-defined group. When you apply a monitoring policy to a group, all applicable members of the group are associated with the policy. The policy associated with an asset appears next to the asset in the wizard. When you apply a policy to all assets in a group, the software disassociates the asset from the assigned policy and associates it with the policy that is assigned to the group.
When you remove the asset from the user-defined group, the asset is associated with the group's monitoring policy until you relocate it to another user-defined group that has a different policy or you manually associate the asset with a different monitoring policy.
4.6.5 Editing the Monitoring Configuration of an Asset Bound to a Monitoring Policy
Monitoring configurations contain monitoring policies and are associated with an asset type, such as an operating system. You can edit specific rules and parameters, but you cannot edit general monitoring policy properties, such as name and description after you create the policy. Editing a policy changes the monitoring configuration for all associated assets.
You can modify the monitoring configuration of an individual asset. When you create a monitoring configuration, the asset is no longer associated with the monitoring configuration and policies for that asset type. Instead, it has its own independent monitoring configuration.
When you modify a monitoring configuration for an asset, you create a policy and the asset is associated with the new created policy.
4.6.6 Creating a Group of Assets According to Monitoring Policy
When you create a user-defined group, you can specify a rule that filters out the assets based on the name of the associated monitoring policy. You can use this to group all the assets associated with a given monitoring policy or to find assets that are not associated with a specific policy.
When viewing the monitoring configuration of an asset, you can navigate to the definition of the monitoring policy bound to the asset.
4.6.7 Extracting a Monitoring Policy
Extracting a monitoring policy is similar to copying a policy. Copying a policy is performed from the policy view, while extracting a policy is performed from the asset view, as shown in Figure 4-4.
Figure 4-4 Extract a Monitoring Policy Action
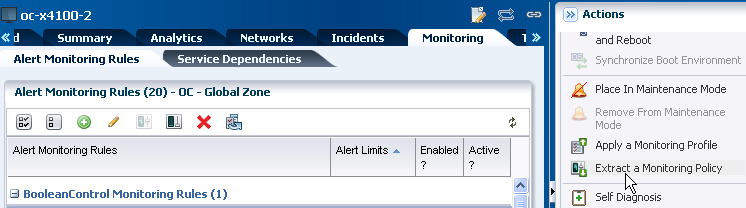
Description of "Figure 4-4 Extract a Monitoring Policy Action"
By extracting a policy from the asset view, you filter the possible subtypes to only those that are valid. You can change the target subtype to a more specific or a more generic eligible target type. To be eligible, the policy must be a member of a more general policy for the specified target. If a list of valid target types does not display, then the target type cannot be changed.
You can specify one of the following as the OS subtype for the new policy:
-
Oracle Solaris 10: Any Oracle Solaris 10 operating system.
-
Oracle Solaris 10 Operating System: Any Oracle Solaris 10 8/07 (update 4) or higher operating system. You might use this subtype if you want to use the policy for zones.
-
Oracle Solaris: Any supported Oracle Solaris operating system release.
-
Operating System: Any supported Oracle Solaris, Linux, or Windows operating system.
Perform the following steps to extract a monitoring policy:
-
Expand Assets in the Navigation pane, then click an asset type, such as operating system.
-
Click the Monitoring tab, then click Extract Monitoring Policy in the Action pane.
-
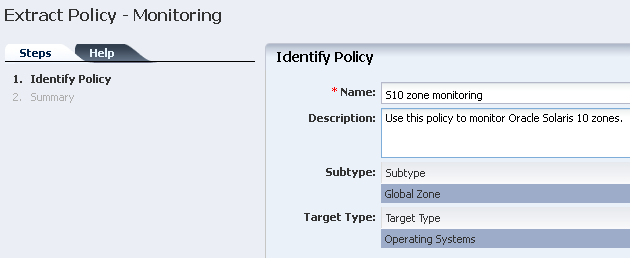
Enter a name and description for the new policy, then select the subtype and target type. Click Next.
-
Click Finish to add the policy to the list of available policies.
-
To see the new policy, expand Plan Management and click Monitoring Policies. Click the policy to display details.
4.6.8 Adding or Copying a Monitoring Policy
You can add a new monitoring policy or copy an existing monitoring policy.
Perform the following steps to add or copy a monitoring policy:
-
Expand Plan Management in the Navigation pane, then click Monitoring Policies.
-
Click Copy Policy or Create Policy in the Action pane
-
Enter a name and description for the new policy, then select the subtype and target type.
-
Click Next, then click Finish to add the policy to the list of available policies.
-
To see the new policy, expand Plan Management and click Monitoring Policies. Click the policy to display details.
-
To add or remove rules or change monitoring parameters, double-click the policy in the center content pane
-
To view all assets that are monitored with this policy, click View Associated Assets
-
To make this policy the default monitoring policy, click the Set as Default Policy icon
-
4.6.9 Deleting a Monitoring Policy
You can delete user-defined monitoring policies in the Plan Management section. Resources are associated with a monitoring policy. When you delete a user-defined monitoring policy, any asset or group associated with that policy is automatically detached from the policy. However, the asset does retain the monitoring configuration that was defined by the policy.
You cannot delete system-defined policies.
4.7 Related Resources for Monitoring Rules and Policies
For instructions in performing actions or to learn more about the role of this feature, go to one of the following resources:
-
See Chapter 11, "Hardware" for information about hardware monitoring.
-
See Chapter 12, "Operating Systems" for information about monitoring operating systems.
-
See Chapter 9, "Incidents" for information about managing incidents that result from monitoring.
-
See Appendix G, "Expression Query Language" for details about the expression query language, grammar, lexical elements, and method details.
-
For end-to-end examples, see the How To library at
http://docs.oracle.com/cd/E27363_01/nav/howto.htm. The following How To documents relate to monitoring:-
Understanding OS Performance and Capacity
-
Tuning Monitoring Rules and Policies
-