9 Incidents
This chapter describes how you can use the software to identify, assign, and resolve incidents.
The following information is included:
9.1 Introduction to Incident Lifecycle Management
When an asset is not operating within the parameters defined in the monitoring rules and policies, Oracle Enterprise Manager Ops Center generates an alert and an incident.
An alert indicates that a monitored asset is not performing as expected. The monitoring rule parameters determine when an alert is triggered and the severity: Informational (info), Warning, or Critical.
An incident is raised when the monitoring rule is asserted by the raising of one or more alerts that the monitoring rule requires. New alerts will update an open incident. One or more subsequent alerts trigger the monitoring rule, which notifies the incident management system. The incident management system detects that there is already an open incident for the monitoring rule for that asset and correlates the alerts under the open incident and the worst severity level is associated with the incident. For example, when the incident is at a Critical severity level and a new Warning alert is added to the incident, the incident severity remains at the Critical level.
Oracle Enterprise Manager Ops Center uses a help desk approach to manage the incidents in your data center. All open incidents appear in the Message Center. You can assign incidents to others for resolution, add comments, provide a list of possible causes and impacts, provide recommendations, add utilities or scripts to resolve an issue, view progress, and open a service desk ticket.
The following are the main components that help you to track and manage known issues on your monitored assets:
-
Message Center: Central location for details on incidents, notifications, and service requests.
-
Annotations: Comments, suggested actions, and operational plans that enable you to effectively manage an incident.
-
Incidents Knowledge Base: Database of your annotations and actions for specific types of incidents and severity levels.
-
Oracle Services and Service Requests: Service request details on all requests submitted to My Oracle Support through Automated Service Request or the Oracle Enterprise Manager Ops Center UI. See the Oracle Enterprise Manager Ops Center Administration Guide for information about Automated Service Requests and how to enable them.
When an incident appears, you can assign it to a user for resolution and use annotations to add comments and suggested actions. You can build an Incident Knowledge Base that contains your annotations from specific incidents, or add suggested fixes or automated fixes for a specific type of incident.
If you cannot resolve an incident, you can open a service request with My Oracle Support inside the Oracle Enterprise Manager Ops Center UI. The information gathered by the software is automatically populated into the service request. You can track the status of any service request opened from within Oracle Enterprise Manager Ops Center, whether they belong to you or one of your co-workers.
9.2 Roles for Incident Management
The following table lists the tasks that are discussed in this section and the role required to complete the task. You can restrict privileges to specific targets or groups of targets. Contact your administrator when you do not have the necessary role or privilege to complete a task. Contact your administrator if you do not have the necessary role or privilege to complete a task. See the Oracle Enterprise Manager Ops Center Administration Guide for information about the different roles and the permissions they grant.
Table 9-1 Incident Management Tasks and Roles
| Task | Role |
|---|---|
|
View Incidents |
All |
|
Assign Incidents |
Fault Administrator |
|
Add Annotation to incidents |
Fault Administrator |
|
Acknowledge incidents |
Fault Administrator |
|
Take Actions on Incidents |
Fault Administrator |
|
Mark Incidents as Repaired |
Fault Administrator |
|
Close Incidents |
Fault Administrator |
|
Take Actions on Notification |
Fault Administrator |
|
Delete Notifications |
Fault Administrator |
9.3 Actions for Incident Management
Incident management is automatically enabled after an asset is discovered and managed. Alerts and incidents are generated based on the monitoring profiles and policies.
9.3.1 Actions for Incidents
You can perform the following actions for a specific incident:
-
View Alerts: View all alerts that are generated when the state is outside the defined monitoring parameters.
-
View Annotations: View the scripts or suggested actions that you or others in your organization have associated with an incident.
-
View Possible Impacts and Causes: View the possible impacts and causes for an incident.
-
View Comments: View comments that you or others in your organization have associated with an incident.
-
View Suggested Actions: View suggested actions that you or others in your organization have associated with an incident.
-
Add Annotation to the Incident: Add a script, suggested action, or comment to a specific incident.
-
Assign the Incident: Assign an incident to a user.
-
Acknowledge the Incident: Acknowledge, or accept, and incident that has been assigned to you.
-
Take Actions on the Incident: Take action to resolve an incident. Options include executing a suggested action, executing a script that is part of an operational profile, executing a command, or executing a script.
-
Mark Incident as Repaired: Identifies the incident as being fixed.
-
Close the Incident: Closes the incident and removes it from the Message Center.
-
Open a Service Request: Open a service request for the incident with My Oracle Support.
9.3.2 Actions for Service Requests
When the Enterprise Controller is connected to My Oracle Support and service requests are enabled, you can perform the following service request actions:
-
View all open service requests: View all open service requests that were filed with the Oracle Enterprise Manager Ops Center software.
-
View your service requests: View open service requests that you filed with the Oracle Enterprise Manager Ops Center software.
9.3.3 Actions for Incidents Knowledge Base
The Incidents Knowledge Base is located in the Operational Plans section of the Plan Management section. You can perform the following actions for the Incidents Knowledge Base:
-
View and sort the annotations by type: The Incident Knowledge Base appears as a table with the name, description, subtype, target type, version and date the annotation was last updated.
-
Add an annotation for an Incident type: Add a comment, suggested action, or automated action for a type of incident and monitored attribute. You define the severity levels that the annotation is applicable.
-
Edit an annotation for an incident type: Edit an annotation for a type of incident.
-
Delete an annotation for an incident type: Delete an annotation for a type of incident.
9.4 Location of Incident and Service Request Information in the User Interface
Incident and service request information is available in the Message Center in the Navigation pane. Use the Message Center to view and manage view notifications, service requests and warranty information for an asset. You can also view incident details by expanding the asset and clicking the Incident tab.
Table 9-2 Location of Incidents and Service Request Information in the UI
| Object | Location |
|---|---|
|
Unassigned Incidents |
Expand the Message Center in the Navigation pane, then click Unassigned Incidents. Or, click the asset in the Assets section, then click the Incidents tab. |
|
My Incidents |
Expand the Message Center in the Navigation pane., then click My Incidents. Or, click the asset in the Assets section, then click the Incidents tab. |
|
Incidents Assigned to Others |
Expand the Message Center in the Navigation pane, then click Incidents Assigned to Others. Or, click the asset in the Assets section, then click the Incidents tab. |
|
Open Service Requests |
Expand the Message Center in the Navigation pane, then click Open Service Requests. |
|
My Service Requests |
Expand the Message Center in the Navigation pane., then click My Service Requests. |
|
Notifications |
Expand the Message Center in the Navigation pane, then click Notifications. |
|
Relayed Incidents |
Expand the Message Center in the Navigation pane, then click Relayed Incidents. |
|
Relayed Service Requests |
Expand the Message Center in the Navigation pane, then click Relayed Incident Requests. |
|
Incident Knowledge Base |
Expand Plan Management in the Navigation pane, then click Incident Knowledge Base. |
9.5 Incidents
Each time a monitored attribute does not meet its monitoring rule, a new alert is generated. The first alert raises an incident, which appears in the Message Center. Subsequent alerts for the same rule and asset are correlated with the same open incident.
When a value for an attribute exceeds its monitoring rule and then later meets the rule, the alert is cleared automatically. The change in the attribute value does not automatically clear the incident. When an attribute's value is moving in and out of its monitoring rule's parameters, alerts are generated and cleared continuously. A new incident is only generated when the original incident is closed. When an incident is not yet closed, the new alerts are aggregated into the existing incident. You must close an incident to clear it from the user interface.
9.5.1 About Incident Severity Badges
Incident severity badges are an option that you can enable to display an incident severity badge next to an asset show the incident status. Badges also appear in the dashboard membership graph to show the status of an asset. See Badges in Appendix E for a description of each badge.
To Display Incident Severity Badges
Perform the following to display the badges in the Navigation pane:
-
Click Setup in the upper right corner of the UI.
-
Click My Preferences, then click User Interface Preferences.
-
Click the check box to make the badges visible in the user interface.
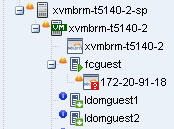
When an asset has an incident, the severity badge appears next to the asset icon in the Asset hierarchy. When it is the highest severity incident in the membership of a group, the severity badge also appears next to the parent assets. In Figure 9-1, the operating system for xvmbrm-t5140-2 has a critical incident. The critical incident badge also appears on the system and service processor. Any group that this OS is a member of, such as All Assets and Operating Systems, also display the badge.
When the incident is the only critical incident, the badge is removed when the incident is acknowledged, marked repaired, or closed. When open incidents are still present, the next highest severity badge displays. For example, when both a Critical and a Warning incident is detected and the Critical incident is acknowledged, the Critical badge is replaced with the Warning badge because that is now the highest level unacknowledged incident.
After the incident is closed, its severity badge is not displayed in the asset hierarchy.
See Chapter 4, "Monitoring Rules and Policies" for more information about creating and maintaining monitoring rules and profiles.
An incident is one or more alerts on the same monitored attribute and asset. A ticker at the top of the UI contains the number of unassigned critical incidents, unassigned Warning incidents, number of relayed incidents, the number of critical incidents and the number of warning that are assigned to you. You can click an icon to display the incidents dashboard for that category.
9.6 Message Center
Incidents, notifications, and service requests that are generated by managed assets appear in the Message Center. Your assigned user role determines the actions that you can perform in the Message Center.
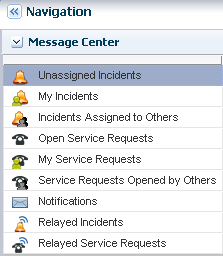
Incidents, notifications and service requests appear in the following categories in the Message Center:
-
Unassigned Incidents: Newly created incidents and those that have not been assigned an owner.
-
My Incidents: All incidents that are assigned to you. You can perform additional actions to these incidents to manage their status, such as: Take Action, mark as being repaired, acknowledge, and open a service request for the incident.
-
Incidents Assigned to Others: Incidents that are currently assigned to other users. You can view these incidents, but you cannot perform specific actions on them.
-
Open Service Requests: All Service Requests that have been filed on assets that are submitted through Oracle Enterprise Manager Ops Center.
-
My Service Requests: All Service Requests that you submitted on assets that are managed by Oracle Enterprise Manager Ops Center.
-
Service Requests Opened by Others: All Service Requests that have been submitted on assets that are managed by Oracle Enterprise Manager Ops Center.
-
Notifications: Information that is automatically generated by services running in the backend while monitoring the assets. Typically, notifications are less important than incidents.
-
Relayed Incidents: All incidents reported from any discovered Oracle Engineered System. You must log in to the Oracle Enterprise Manager Ops Center instance that manages each Oracle Engineered system to fix any incidents related to its assets.
-
Relayed Service Requests: All open Service Requests for any discovered Oracle Engineered System.
Closed incidents and service requests do not appear in the Message Center.
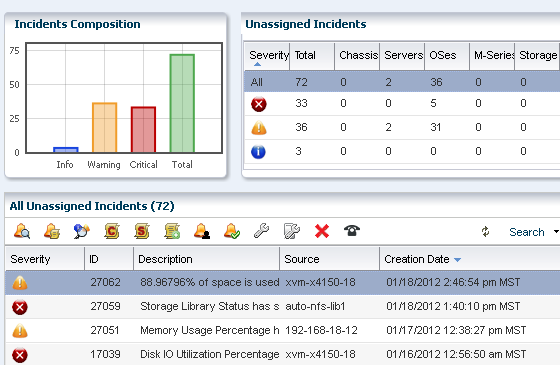
A bar chart on the page visually displays the number of new incidents by severity and the total number of unassigned incidents. The page also contains a table that categorizes the incidents by severity and asset type. Select a row in the table to display all unassigned incidents for the selected severity category. A third table, at the bottom of the dashboard provides details and action icons.
The All Unassigned Incidents table shows all open unassigned incidents. Each incident receives an ID to help you to track the issue. The table includes a description, source, Creation Date, and URL field for each incident. Hover over the URL icon for an incident to display a pop-up window. The default sort is by the creation date; however, you can sort by any column.
Figure 9-5 Unassigned Incidents Dashboard
Description of "Figure 9-5 Unassigned Incidents Dashboard"
The following information is available in the Unassigned Incidents table:
-
Severity: The severity icon shows the severity level, either informational (info), warning, or critical.
-
ID: A generated ID assigned to the incident to help track the issue.
-
Description: A brief description of the incident.
-
Source: The asset that is generating the incident.
-
Creation Date: The date and time that the incident generated.
-
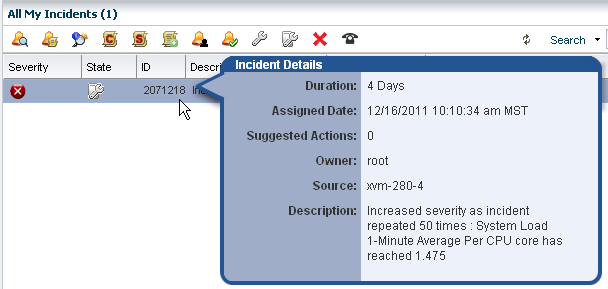
URL: Contains incident details. Hover over the URL icon to display the duration of the incident, when the incident was assigned, to whom the incident was assigned, any suggested actions, the source of the incident, and a larger description field.
A row of icons at the top of the Unassigned Incidents table provides actions that are available to you, based on your user role. The following action icons are available for incidents, the actions are in the order that the icons appear in Figure 9-6:
9.6.1 Incidents Dashboards in the Message Center
Incidents assigned to you appear in the My Incidents dashboard in the Message Center. Anybody with the appropriate permission level can see the incidents in your queue, can reassign incidents to another user, and can assign you new incidents. Unassigned Incidents and Incidents assigned to others have their own categories in the Message Center. Each Incident dashboard is laid out the same.
A bar chart on the page visually displays the number of new incidents by severity. The page also contains a table that categorizes the incidents by severity and asset type.
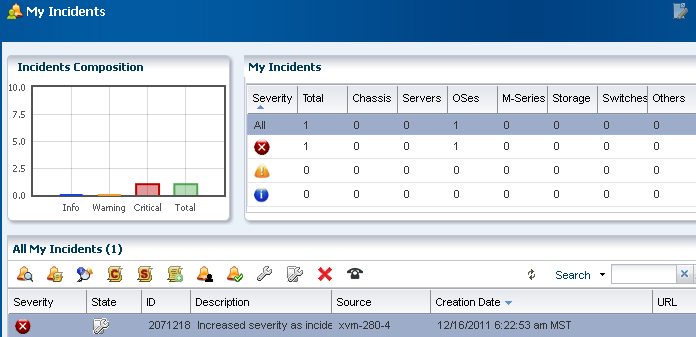
Select a row in the table to display all incidents for the selected severity category and to drill down for more details. The software assigns each incident an ID for tracking purposes. Hovering your mouse over any field in the incident row displays details.
The icons in the center pane enable you to perform actions on a specific incident or view the alerts that make up an incident in the center pane. Each icon has text to define the action.
The following actions, as described in Actions for Incident Management, are available:
You can configure the software to send you e-mail or pager notification of incidents for critical assets or severity levels. The Notifications appear in the Message Center.
9.7 Annotations
Annotations are comments, suggestions, or automated operations with associated scripts that you can use to document an incident. They are defined by an asset type, asset resource type, an attribute, or an incident type.
Annotations are as powerful as you want to make them. You can View Annotations, View Possible Impacts and Causes, View Comments, View Suggested Actions, and Add Annotations that are associated with an incident in the Message Center or from the Incidents tab in the Asset view, as shown in Figure 9-10.
You can add informational comments and notes to an issue while you are working on a resolution, when you mark an incident as fixed, and when you close an incident.
You can associate annotations with an incident instance or an asset type. The Incidents Knowledge Base contains your annotations, by asset type, and stores the information on the Enterprise Controller. You can view this annotation by browsing the Incidents Knowledge Base.
For more robust incident management, associate an annotation with an incident and store the annotation in the Incidents Knowledge Base to provide an automated solution or a suggested action when a similar incident is detected. To provide an automated solution, create an operational plan that contains a shell script. When a specific incident occurs, the script is executed automatically. To provide a suggested fix or course of action for a specific incident, you can create a text only annotation that provides a suggested course of action, or you can include a shell script.
When a rule is triggered, and an alert or incident is identified, the software checks the Incidents Knowledge Base and Incident Profiles for the Incident Type and any associated annotations. The software generates an incident of the defined type and severity level and attaches any annotations. When an automated operation annotation is associated with the incident, the script is executed. When a suggested action annotation is associated with the incident, the text and script (when available) appear in the incident details.
9.7.1 About Annotation Views
Annotations are available from several different views within the UI:
-
In the Message Center, when an annotation is associated with an incident
-
In the Asset view, when an annotation is associated with an incident
-
In the Incident Knowledge Base (in the Plan Management section), when an annotation is associated with an asset type
When an annotation is associated with an incident, you can click the View Annotations icon to see the associated annotation.
You can create annotations by an asset type, asset resource type, an attribute, or an incident type. The annotations are located in the Incidents Knowledge Base (KB). Annotations are automated operations with associated operational profile, suggested fixes or actions, or text only comments. You can associate Automated Action and Suggested Action annotations with an operational profile, which can contain a script.
You can also add an annotation to the Incidents KB when you add an annotation to a specific incident.
A comment is a type of annotation. You can add informational comments and notes to an issue while you are working on a resolution, when you mark an incident as fixed, and when you close an incident. You can also use annotations to build a Incidents Knowledge Base that contains a mixture of comments, suggested actions, and automated actions. To add a comment, see Adding an Annotation.
Annotations in the Incidents Knowledge Base (KB) are associated with types of incidents. You can delete an annotation in the Plan Management section of the UI.
9.8 Incidents Knowledge Base
Annotations enable you to build a Incidents Knowledge Base that contains a mixture of comments, suggested actions, and automated actions.
You can use your annotations to build an Incidents Knowledge Base that is based on your company policies, procedures, and incidents.
You can add annotations to the Incidents Knowledge Base in Plan Management or from a specific incident. Either way, annotations enable you to provide solutions or recommended actions for specific incidents.
The following types of Annotations are available:
-
Automated Operation: You can create an annotation that references an Operational Profile and automatically executes the profile when a specific incident occurs.
-
Suggested Action: You can provide a suggested fix or course of action for a specific incident. The suggested course of action can be text only, or you can reference an Operational Profile.
-
Comment: You can write notes about the situation, such as the current status of an incident. This is a text only field.
You can build an Incident Knowledge Base that contains your annotations from specific incidents, or add suggested fixes or automated fixes for a specific type of incident. You can add possible causes and impacts or you can add an annotation. An annotation is either a comment or a suggested action. Annotations enable you to associate an operational plan that contains a utility or script to correct a specific issue. You can choose to associate the annotation with all incidents of the same type and severity and save it in the Incidents Knowledge Base. The next time the incident occurs, you can access the possible causes and impacts and annotations identified in the previous incident and resolve the issue more quickly.
When an incident is detected, Oracle Enterprise Manager Ops Center checks the Incidents Knowledge Base and Incident Profiles for the asset type and corresponding incident type. Any associated annotations are added to the Incident and Operational Profiles referenced in Automated Operation annotations are executed against the asset on which this incident was open. You can create, update, and delete annotations in the Incidents Knowledge Base.
9.9 Annotations in the Incidents Knowledge Base
For more robust incident management, you can associate an annotation with a rule and store the annotation in the Incidents Knowledge Base to provide an automated solution or a suggested action when a specific incident is detected. To provide an automated solution, create an operational plan that contains a shell script. When a specific incident occurs, the script is executed automatically. To provide a suggested fix or course of action for a specific incident, you can create a text only annotation that provides a suggested course of action, or you can include a shell script.
When a rule is triggered, and an alert or incident is identified, the software checks the Incidents Knowledge Base and Incident Profiles for the Incident Type and any associated annotations. The software generates an incident of the defined type and severity level and attaches any annotations. When an automated operation annotation is associated with the incident, the script is executed. When a suggested action annotation is associated with the incident, the text and script (when available) appear in the incident details.
Annotations are automated operations with associated scripts, suggested fixes or actions, or text-only comments. You can associate annotations with an incident instance or an asset type. The Incidents Knowledge Base contains your annotations, by asset type, and stores the information on the Enterprise Controller. This annotation can be viewed by browsing the Incidents Knowledge Base.
-
Open the incident from the Message Center or Assets view.
-
Message Center View: Click Message Center, then click an Incident category: Unassigned Incidents, My Incidents, or Incidents Assigned to Others.
-
Assets View: Click the asset in the Assets section of the Navigation pane, then click the Incidents tab in the center pane.
-
-
Click the incident in the center pane.
-
Click the View Annotations icon.
Example 9-1 Example of Using Annotations
The CPU usage on a Sun Fire x4150 host is exceeded and an incident is generated. You assign the incident to Lee. Lee is concerned because these systems are often used to host Oracle Solaris Zones. Lee adds the following comment to the incident: "This asset is not powerful enough and cannot cope with the load". Lee also wants to associate an annotation with the Global Zone asset type to recommend checking for processes that are consuming excessive CPU usage on the Global Zone. Lee adds the following annotation to the asset type: "Run the 'prstat 1 1' command to check which processes are taking CPU." The annotation is saved in the Incidents Knowledge Base and appears the next time CPU usage is exceeded on a global zone asset type.
9.10 Incident Lifecycle Management
Incident management in Oracle Enterprise Manager Ops Center consists of several components that are designed to work together to simplify managing incidents for a large number of assets. The components include monitoring rules, suggested actions, and methods for automating incident identification and resolution.
Monitoring includes a standard set of monitoring rules, consisting of an asset's attribute and the threshold value for that attribute. When Oracle Enterprise Manager Ops Center performs monitoring, it generates alerts, which connect to both the incident management and notification features.
When an asset is not operating within the parameters defined in the monitoring rules and policies, Oracle Enterprise Manager Ops Center generates an incident and displays the information in the Unassigned Incidents section. Incidents appear as Informational (Info), Warning, or Critical severity. All incidents appear in the Message Center. When an incident is first detected, it appears in the Unassigned category. When you assign an incident to yourself, it moves from the Unassigned Incidents to My Incidents. When an incident is assigned to someone else, it appears in Assigned Incidents.
For example, the CPU usage on a Sun Fire x4150 host is exceeded and an incident is generated. You assign the incident to Bob. Bob is concerned because these systems are often used to host Oracle Solaris Zones.
Bob reviews the incident and adds the following comment to the incident: This asset is not powerful enough and cannot cope with the load. Bob also wants to associate an annotation with the Global Zone asset type. He wants to add a recommended action annotation to the asset type to check for processes that are consuming excessive CPU usage on the Global Zone. He adds the following annotation to the asset type: Run the prstat 1 1 command to check which processes are taking CPU. The annotation is saved in the Incidents Knowledge Base and displays the next time CPU usage is exceeded on a global zone asset type.
9.10.1 Methods of Incident Management
Oracle Enterprise Manager Ops Center uses a help desk approach to managing incidents. The following are the key tools available for taking action on an incident:
-
Message Center: View the status of incidents and assign incidents.
-
Annotations: Add notes and change status. Use annotation options to provide recommended actions or fixes, or add custom scripts to provide an automated response to an incident.
-
Operational Plans: Deploy a shell script against a specific asset, or asset sub-type to automate incident resolution.
-
Incidents Knowledge Base: Collect comments and suggested actions for known issues for future use.
When you want to receive e-mail or pager notification each time an incident is reported in the Message Center, you can create notification rules to send a message advising you of a new critical or warning incident.
The Message Center contains a detailed list of unassigned incidents, incidents assigned to you, and incidents assigned to other users.
You can manage incidents from either the Message Center or from the Asset view. You can view and add comments and annotations, take action on an incident, and close incidents.
-
The Message Center provides a list of all incidents. Select an incident to see its details and activity.
-
From the Asset tree in the Navigation pane, select the asset and then click the Incidents tab to see a list of incidents for that asset.
When you have the Manage or Admin role for the asset, you can take action on the incident. The person assigned to the incident must also have the Manage or Admin role. When the icon is not active, you do not have the appropriate role.
9.10.2 Viewing Unresolved Incidents
You can view unresolved incidents for a specific asset or by incident:
-
To view unresolved incidents for a specific asset, click the asset in the Navigation pane, then click the Incidents tab in the center pane.
-
To view unresolved incidents from the Message Center, click one of the following:
-
Unassigned Incidents
-
My Incidents
-
Incidents Assigned to Others
The number of unresolved incidents for an asset appears in a bar chart and in a summary by severity. All Unresolved incidents appear in a table.
-
View high-level details by hovering your mouse over the incident or clicking the incident in the Unresolved Incidents table. You can drill down to view the alerts that make up the incident by clicking the incident, then clicking the Alerts icon in the center pane.
9.10.3 Viewing Incident Details
A incident consists of one or more alerts. You can view incident details, including the individual alerts that are part of the incident. The following incident details are available:
-
How long the incident has been open, or the duration
-
When the incident was assigned
-
The number of suggested actions for the incident
-
Who is assigned to the incident
-
Which resource is affected, or the cause
-
A description of the incident
Perform the following steps to view incident details:
-
Select Assets in the Navigation pane.
-
Select an asset that has an incident badge next to the icon. The Dashboard page displays with the status of the asset.
-
Click the Incidents tab.
-
Hover over the incident to display the incident details.
-
To display the alerts that are associated with the incident, click the Alerts sub-tab or click the Alerts icon in the center pane. The alerts that make up the incident are displayed, including the current and highest alert status, and the alert history.
9.10.4 Assigning an Incident
You can assign an incident to a user who has Manage or Admin role for the asset.
Assigning an incident might affect the asset's Incident severity badge. When an incident was previously acknowledged or marked as being repaired, its severity was not propagated up to antecedent assets in the navigation pane. After assigning an incident (to a user or to no one), the severity is propagated up again to antecedent assets in the navigation pane.
-
To display an incident from the Message Center, click Message Center, then click Unassigned Incidents in the navigation pane.
To display an incident from the asset view, click the asset in the Navigation pane, then click the Incidents tab.
-
Select one or more incidents in the center pane, then click the Assign Incidents icon.
-
Select a user name from the Assign To list, which is the list of users who have either the Manage or Admin role for the asset. To relocate an assigned incident back to the Unassigned Incidents queue, select No One from the list.
-
(Optional) Add a note in the text field.
-
Click Assign Incidents.
9.10.5 Acknowledging Incidents
Acknowledging an incident indicates that you are investigating the issue. You can acknowledge an incident when you have the Admin or Manage role for the asset on which the incident is identified.
When severity badges are enabled and an incident occurs on an asset, a severity badge appears next to the asset in the Asset hierarchy. When it is the highest severity incident in the membership, it also appears next to the parent assets. In Figure 9-12, the operating system for xvmbrm-t5140-2 has a critical incident. The critical incident badge also appears on the system and service processor. The badge appears on any group that this operating system is a member of, such as All Assets and Operating Systems.
Figure 9-12 Critical Incident Badge on Asset and Parent Assets
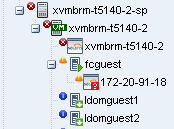
Description of "Figure 9-12 Critical Incident Badge on Asset and Parent Assets"
When the incident was previously in an Unassigned state or was assigned to someone else, the severity was taken into account in the computation of the highest severity to propagate up to antecedent assets in the navigation pane. When you acknowledge an incident, it is moved into your queue in the Message Center and the severity is no longer propagated up to antecedent assets in the navigation pane.
When you acknowledge the Critical incident, the badge is replaced with the Warning badge because that is now the highest level unacknowledged incident.
Figure 9-13 Effect of Acknowledging a Critical Incident
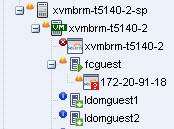
Description of "Figure 9-13 Effect of Acknowledging a Critical Incident"
-
Open the incident from the Message Center or Assets view.
-
Message Center View: Click Message Center, then click an Incident category: Unassigned Incidents, My Incidents, or Incidents Assigned to Others
-
Assets View: Click the asset in the Assets section of the Navigation pane, then click the Incidents tab in the center pane.
-
-
Select one or more incidents, then click the Acknowledge Incidents icon in the center pane.
9.10.6 Adding an Annotation
Annotations are defined by the asset type. Annotations are comments, a suggested action, or a reference to an operational profile. Any user can add an annotation to a Incident. To add an entry to the Incidents Knowledge Base requires Oracle Enterprise Manager Ops Center Admin permissions.
-
Open the incident from the Message Center or Assets view.
-
Message Center View: Click Message Center, then click an Incident category: Unassigned Incidents, My Incidents, or Incidents Assigned to Others
-
Assets View: Click the asset in the Assets section of the Navigation pane, then click the Incidents tab in the center pane.
-
-
Select the incident, then click the Add Annotations icon in the center pane.
-
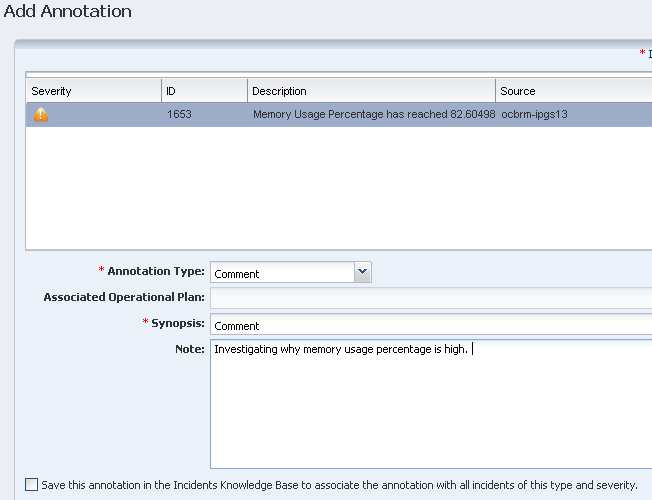
Select one of the following types from the Annotation Type from the drop-down list:
-
Comment: Text only option that is designed to be used to add a note or editorial comment.
-
Suggested Action: Text required and a script is optional.
-
-
Select an operational plan from the drop-down list of operational profiles defined for the type of asset on which this incident is open.
-
The Synopsis field is completed based on the annotation type. Edit the synopsis, as needed. The UI does not have a character limit, but the API allows for 80 characters.
Note:
When you enter more than 80 characters, the synopsis is truncated to the first 80 characters when viewed in the annotation. -
Type a description or instructions in the Note field. There is no character limit.
-
To add the annotation to the Incidents Knowledge Base and include the annotation for every incident of this type and severity, click the check box.
Note:
You must have the Oracle Enterprise Manager Ops Center Admin role to complete this operation. -
Click Save and Execute or click Save.
9.10.7 Displaying Annotations
You can display annotations for an asset type in the Incidents Knowledge Base.
-
Click Plan Management.
-
Expand Incidents Knowledge Base in the Navigation pane, then select the asset type. The annotations associated with the asset type appear in the center pane.
9.10.8 Viewing Comments
A comment is a type of annotation. You can add informational comments and notes to an issue while you are working on a resolution, when you mark an incident as fixed, or when you close an incident. You can also use annotations to build a Incidents Knowledge Base that contains a mixture of comments, suggested actions, and automated actions. To add a comment, see Adding an Annotation.
-
Expand the Message Center, then click one of the following:
-
Unassigned Incidents
-
My Incidents
-
Incidents Assigned to Others
-
-
Click the incident in the center pane, then click the View Comments icon.
9.10.9 Taking Action on a Incident
When you have the Manage or Administration role for an asset that has an open incident, you can correct some incidents by using a script or command. In these situations, you might want to associate an automated action with some known issues. For other incidents, you might want to review the issue before deciding on the appropriate action.
The incident management functionality provides varying levels of control. You can build the Incidents Knowledge Base with annotations that contain a combination of automated actions, suggested actions, and comments. You can execute one or more of the suggested actions associated with the Incident or use an operational plan to correct the incident. When an action is not available in a suggested action or Operational Profile, you can execute a command or a custom script that is stored on the managed asset or on the Enterprise Controller.
See Adding an Annotation for information on adding a suggested action to a Incident.
See Incidents Knowledge Base to add a suggested action or automated action in the Incidents Knowledge Base. See Creating an Operational Profile and Plan for information about creating an operational profile.
-
Open the incident from the Message Center or Assets view.
-
Message Center View: Click Message Center, then click an Incident category: Unassigned Incidents, My Incidents, or Incidents Assigned to Others
-
Assets View: Click the asset in the Assets section of the Navigation pane, then click the Incidents tab in the center pane.
-
-
Select the incident.
-
Click the Take Actions on a Incident icon in the center pane.
-
Select the action to perform:
-
When the Incidents Knowledge Base has provided a suggested action for the incident, select Execute the Selected Suggested Action option and then select the action from the table.
-
When an operational plan has a suggested action, select the Execute an Operational Plan option, then select the plan from the drop-down list.
-
To run a script or command that is not part of a suggested action or operational plan, select the Execute a Command or Script File option.
-
To execute a command, enter the command in the field.
-
To browse for a script, click Browse and then select the script from the File Chooser popup.
-
-
-
Select where to run the script, on the managed asset where the incident is open, or on the Enterprise Controller.
-
Define the time out period for the action, in minutes, hours, or days.
-
(Optional) Add a note describing the action taken.
-
Click Execute Selected Action.
9.10.10 Maintenance Mode
Maintenance mode is designed to disable assets from generating incidents temporarily. This mode is useful when you plan to power off a hardware asset or reconfigure a system manually, and you do not want incidents to appear in the UI.
Note:
Alerts are still generated when the asset is in maintenance mode. View alerts by selecting the Alerts tab, which is a subtab of the Incidents tab.When an asset is placed in maintenance mode, the severity badge of unassigned and assigned incidents affecting the asset and its children is not propagated up the asset membership hierarchy in the navigation pane.
When the maintenance operations are completed, use the Remove From Maintenance action to begin monitoring the asset. When the asset is removed from maintenance mode, the severity badge appears in the asset membership hierarchy in the navigation pane.
-
To remove an asset from monitoring, highlight the asset in the Navigation pane, then click Place in Maintenance in the Actions pane.
-
To begin monitoring the asset, highlight the asset in the Navigation pane, then click Remove From Maintenance in the Actions pane.
9.10.11 Marking an Incident Repaired
The software cannot determine when an incident is repaired. However, you can open a known incident and manually add a note with the repair details and mark the incident as repaired. You must have the Manage or Admin role for the asset to perform this task.
When the incident was previously in an Unassigned state or Assigned to someone, the severity was taken into account in the computation of the highest severity to propagate up to antecedent assets in the navigation pane. After marking this incident as repaired, its severity badge does not appear in the assets list in the navigation pane.
-
From the Message Center, click Message Center, then click one of the following:
-
Unassigned Incidents
-
My Incidents
-
Incidents Assigned to Others
or
From the asset view, click the asset in the Assets section of the Navigation pane, then click the Incidents tab.
-
-
Select one or more incidents, then click the Mark Incidents as Repaired icon in the center pane.
-
(Optional) Select the incident, then add a Note.
-
Click Tag Incidents as Being Repaired.
9.10.12 Closing an Incident
The incident stays open until you close it, even if the alerting condition is cleared. To remove an incident from the Message Center and the asset view, you must close the incident or take no action on it for seven (7) days. When any action is taken on an incident, such as adding an annotation, the counter is reset.
Note:
Incidents with no activity for seven (7) days are closed automatically by Oracle Enterprise Manager Ops Center, and do not appear in the UI. You can edit this value in the public API.When an incident is closed, its status changes to Closed, the incident is deleted from the list of active incidents, and the incident is no longer displayed in the UI. You can retrieve information about a closed incident for 60 days by using the public API. After 60 days, closed incidents are permanently deleted. To edit the time limit, you must edit the value in the public API. You can disable the time limit by setting the value for the number of days to 0.
Note:
When the monitoring condition is still true after the incident is closed, a new alert is raised and a new incident is created.You can close an incident from the asset view or from the following categories in the Message Center:
-
Unassigned Incidents
-
My Incidents
-
Incidents Assigned to Others
Perform the following steps to close an incident from the asset view:
-
Click the asset in the Assets section of the Navigation pane, then click the Incidents tab.
-
Select one or more incidents, then click the Close Incidents icon in the center pane.
-
(Optional) Select the incident, then add a Note.
-
(Optional) To temporarily disable the monitoring rule that identified the incident, click the Action check box, then define when to enable the monitors.
This action does not disable the monitoring rule for all assets. The action disables the monitoring rule for only the assets that were related to the incident to avoid raising a similar incident on the same assets.
-
Click Close Incidents.
9.11 Oracle Services and Service Requests
Oracle Services provides integrated methods for maintaining and displaying current contracts, warranty information, contract dates, and service requests for managed assets.
Use the Oracle Services feature to view the contract or warranty information and any service requests for a specific asset. You can also view service requests that were the result of an alert or incident in Oracle Enterprise Manager Ops Center, view service request details, and file a service request.
-
Contracts and Warranties
Maintaining a valid inventory of the assets in your data center, including contracts and warranties, can be a time-consuming and labor-intensive process. Use Oracle Enterprise Manager Ops Center to display current contract and warranty information for a specific asset, or view the entitlements associated with your Oracle online account. When a contract or warranty is about to expire, Enterprise Manager Ops Center generates an alert.
-
Service Request
You can create new service requests, review your requests, and review the requests of other users.
You can file requests manually, or you can provide credentials and contact information for assets and configure Oracle Enterprise Manager Ops Center to generate service requests. When an incident occurs with an asset, a service request is automatically created using the credentials and contact information that you provided.
Note:
You cannot display service requests created outside of Oracle Enterprise Manager Ops Center. To see the status of any service requests filed outside of Enterprise Manager Ops Center, go to the Service Requests Home page on My Oracle Support.9.11.1 Requirements for Oracle Services
To use these Oracle Services, you must take the following actions:
-
Register your assets with My Oracle Support.
-
Register your user account as a My Oracle Support user so that you can get access to the My Oracle Support database.
-
Run Enterprise Manager Ops Center in Connected Mode.
To access the My Oracle Support database, your user must be registered as a My Oracle Support user. This is the same account that is used to access My Oracle Support at
To determine if you are running in Connected Mode and have access to My Oracle Support, check the icons in the upper right corner of the UI, as shown in Figure 9-14. If an icon does not contain color, you are not connected.
-
The World icon indicates the status of the Internet connection.
-
The Shield icon indicates the status of the connection to the Oracle Knowledge Base.
-
The Phone icon indicates the status of the connection to My Oracle Support Services.
9.11.2 Viewing Contract and Warranty Information
You can display contract information by asset, or you can obtain entitlements associated with all contracts that are associated with a user. Contract and warranty information is available for managed servers that have a serial number associated with a contract in the My Oracle Support database.
The contract and warranty information in Enterprise Manager Ops Center is updated each week so contract changes or new contracts might take up to seven days to appear in the user interface. When a contract or warranty is about to expire, an alert is displayed as an Incident in the Message Center and the contract details appear in orange text in the asset's Summary tab.
Note:
Updating contract and warranty information requires running the product software in Connected mode. If you change to Disconnected Mode, the contract information becomes outdated.To View Contract and Warranty Information For an Asset
-
Select a hardware asset in the Navigation pane, from either the All Asset list or from a group.
-
Click the Summary tab.
When Enterprise Manager Ops Center is in Connected Mode and the serial number of the selected asset is associated with a contract, a Support row is added to the summary. The Support field contains the contract ID and an expiration date.
-
If the contract is within 90 days of expiration, the information is displayed in an orange font.
-
If the contract has expired, the information is displayed in a red font.
-
To View All Contracts Associated with a My Oracle Support Account
9.11.3 Viewing Service Requests
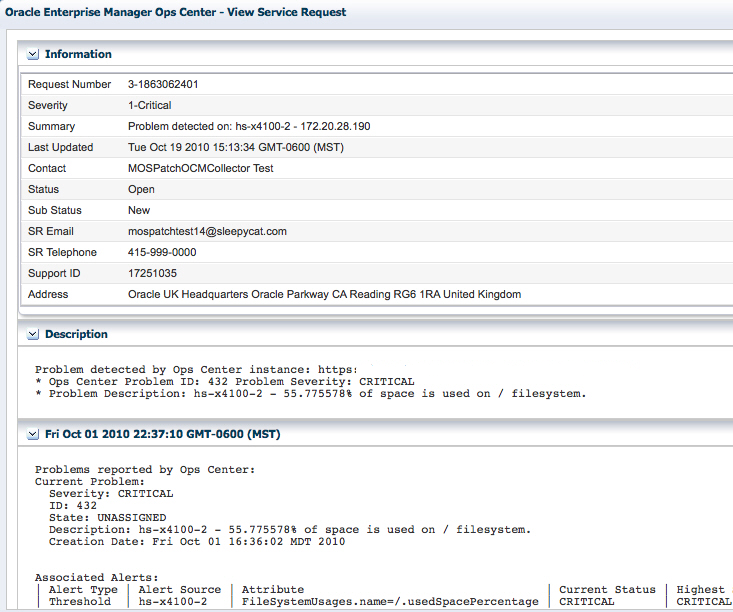
You can see all current and completed service requests that are filed through Oracle Enterprise Manager Ops Center. The service request contains information about the request, including the request number, severity, a summary of the problem, the date and time last updated, contact information, and status.
-
Click Message Center in the Navigation pane.
-
Click Open Service Requests, My Service Requests, or Service Requests Opened by Others to display a list of requests.
-
To view details of a particular service request, highlight a row, then click the View Service Request icon.
-
Click Close.
9.11.4 Filing a Service Request
When your assets are associated with a contract and registered in the Oracle database, you can create a service request from a incident or from an asset. See Requirements for Oracle Services for requirements that must be met before successfully filing a service request ticket. For example, if the asset is not registered in My Oracle Support, the service request job fails. If the Open Service request action is disabled, there is no connection to My Oracle Support.
To File a Service Request From a Incident
-
Click My Incidents or Unassigned Incidents.
-
Select the incident, then click the Open Service Request icon in the center pane.
To File a Service Request From an Asset
-
Select the hardware in the Assets section of the Navigation pane.
-
Click Open Service Request in the Actions pane.
9.11.5 Automated Service Requests
Instead of manually filing a service request, you can configure Oracle Enterprise Manager Ops Center to automatically create service requests for known issues. When Automated Service Requests (ASRs) are enabled, Oracle Enterprise Manager Ops Center automatically generates service requests based on critical incidents. Contact information for the ASR is taken either from Oracle Enterprise Manager Ops Center or from the Customer Service Identifier (CSI) associated with the asset. Annotations are added to the incident to indicate the status of the ASR creation. Once they are created, ASRs are identical to other service requests and can be viewed and managed using the same processes and tools.
A user with the Ops Center Admin role must enable the ASR feature. See the Oracle Enterprise Manager Ops Center Administration Guide for how to configure and use automated service requests.
9.12 Related Resources for Incident Management
For instructions in performing actions or to learn more about the role of this feature, go to one of the following resources.
-
See Chapter 4, "Monitoring Rules and Policies" for information about the monitoring rules that trigger incidents.
-
See Appendix E, "Icons" for a description of the icons.
-
For end-to-end examples, see the How To library at
http://docs.oracle.com/cd/E27363_01/nav/howto.htm. The following How To documents relate to monitoring:-
Managing Incidents
-
Using Service Requests
-