C Designing Accessible Reports
This appendix describes techniques for designing reports to increase accessibility of report output for users with disabilities. Accessibility support is for HTML output only.
This appendix includes the following sections:
-
Section C.2, "Designing Accessible Reports Using RTF Templates"
-
Section C.3, "Designing Accessible Reports Using BI Publisher Layouts"
C.1 Designing for Accessibility
When creating content for consumption by a wide variety of users, you must plan to provide support for users with various disabilities. Such support is a legal requirement in many locations throughout the world.
You can follow several general guidelines when designing content for consumption by a variety of people with differing abilities. These guidelines apply to any content that you create for BI Publisher or other applications. You must also be aware of features that are specific to BI Publisher that ensure that the content that you provide supports accessibility requirements.
This section contains the following topics on designing for accessibility:
C.1.1 Obtaining General Information
You can locate information about accessibility across the Information Technology industry in numerous published books. This guide does not intend to duplicate those works. Various standards and legislation are documented, especially as part of the World Wide Web Consortium (W3C) and Section 508 of the United States Rehabilitation Act.
C.1.2 Avoiding Common Misconceptions
Many designers make assumptions about technology and accessibility. Some of the more common misconceptions include:
-
HTML content automatically equals accessible content.
-
Accessible tools automatically create accessible content.
-
Automated testing tools can reliably determine accessibility.
None of these assumptions is correct. Developers can create non-accessible content using HTML. A tool that can produce accessible content might not do so by default, or might allow a developer to select options that turn off the accessible features within existing accessible content. Automated testing tools do not always interact with content the same way that end users do. As a result, the tools can erroneously report accessible elements as non-accessible. Therefore, accessibility is ultimately the responsibility of the content designer. When creating content, designers must be aware of certain common practices to ensure the content is accessible to all users.
C.1.3 Following General Guidelines for Accessible Content
Always consider the fact that multiple disabilities exist and that multiple disabilities might manifest in the same individual. You must also remember that there are varying degrees of certain disabilities (such as the various types of color vision deficiency). Your designs must take all these possibilities into account.
This section contains guidelines on the following general areas of design:
C.1.3.1 Color Selection
Many different types of color vision deficiency exist, from an inability to see the difference between one common color pair such as red-green (the most common deficiency), all the way to full color blindness where a person can see only varying shades of gray and black. Using only color to convey critical information means that certain users are not fully aware of all the pertinent information about a subject. And, of course, a blind user needs any information conveyed by color to also be present in an alternate textual format.
As a developer, you must not create any content that provides key information by color alone. One example of a non-accessible design is to denote negative numbers solely by coloring the text red. Another example is a typical "stoplight" indicator where the only context information comes from its color — green for good and red for bad.
C.1.3.1.1 Using Color with Text
You can use color in designs if you also include another indication of the same information. For example, you can include a minus sign or parentheses to denote negative numbers in tables and pivots. For stoplight displays, you can add descriptive text or different shaped icons in addition to the color. You can include text such as "Status: good." You can include green circles for "good," yellow triangles for "warning," and red octagons for "bad."
C.1.3.2 Color Contrast
Because color vision deficiency can also manifest as an inability to distinguish between subtle shades of similar colors, overall color design of all screen elements must provide a large amount of contrast. You should strive to achieve a minimum of a 4.5:1 color luminosity contrast ratio. For example, use black text on a white background instead of dark gray text on a light gray background.
You can check the following web sites for assistance:
-
This site offers a tool that can test for the proper level of contrast:
http://www.paciellogroup.com/resources/contrast-analyser.html -
This site offers a tool for viewing how a web site is displayed for individuals with various types of color vision deficiency:
C.1.3.3 Font Selection
Users with low visual acuity often use screen magnification software to make the screen easier to read. The fonts that you use should be readable even when magnified by accessibility tools by as much as 20 times. Some fonts do not display well when magnified, while others do. For example, the Tahoma font magnifies well.
C.1.4 Using the Template Builder to Verify Report Accessibility
You use the Template Builder for Word to create RTF templates that can generate reports with accessibility features. The Template Builder also provides an accessibility checker to review the template for features that enhance the accessibility of the report for report consumers who may need assistive technologies to view the report.
For more information, see Section 5.6.4, "Checking Accessibility."
C.2 Designing Accessible Reports Using RTF Templates
This section describes the following techniques for designing reports using RTF templates. Accessibility support is for HTML output only.
C.2.1 Avoiding Nested Tables or Separated Tables
Avoid using nested tables in a report. For a complex report, try breaking down complex tables into several simple, straightforward tables.
Figure C-1 shows a simple table.
Figure C-2 shows an example of a nested table: A table is inserted inside a table-cell.
C.2.1.1 Examples
The following are examples of table structures that BI Publisher does and does not support for accessibility.
C.2.1.1.1 Nested Tables
BI Publisher does not support accessibility when nested tables are used in a report, as shown in Figure C-3. In this example, BI Publisher cannot tell to which column data "C1R1data" belongs.
Figure C-3 Unsupported Table Layout: Nested Tables in a Report

Description of "Figure C-3 Unsupported Table Layout: Nested Tables in a Report"
Remove the nested table as shown in Figure C-4.
Figure C-4 Supported Table Layout: Nested Tables Removed

Description of "Figure C-4 Supported Table Layout: Nested Tables Removed"
C.2.1.2 Table Headers Must Not Be Separated from the Table Body
The example shown in Figure C-5 is not supported because the header, table body and accessibility fields exist in three different tables.
Figure C-5 Unsupported Table Layout: Header, Body, and Accessibility Fields in Separate Tables

Description of "Figure C-5 Unsupported Table Layout: Header, Body, and Accessibility Fields in Separate Tables"
These three tables should be joined into one to support accessibility, as shown in Figure C-6.
Figure C-6 Supported Table Layout: Three Tables Joined into One

Description of "Figure C-6 Supported Table Layout: Three Tables Joined into One"
C.2.2 Defining a Document Title
You can define a document title. The procedure differs slightly depending on the version of Microsoft Word.
To define or change a document title in Microsoft Word 2007:
-
Click the Office button, click Prepare, and then click Properties.
To define or change a document title in previous versions of Word:
-
On the File menu, click Properties, then click the Summary tab.
C.2.3 Defining Alternative Text for an Image
To define alternative text for an image in the template:
-
Right-click the image.
-
On the menu, click Format Picture.
-
On the Alt Text tab, enter "alt:" followed by the alternative text. For example:
alt:flower picture
Note:
In versions of Word prior to 2007, enter the alt:text syntax on the Web tab.
C.2.4 Defining a Table Summary
Add a table summary to a table by inserting the following command:
<?table-summary: 'My Table Test '?>
in the first column and first row position of the table.
C.2.5 Defining a Table Column Header
You can define a table column header. The procedure differs slightly depending on the version of Microsoft Word.
To define a table column header in Word 2007:
-
Select the heading row or rows. The selection must include the first row of the table.
-
On the Design tab, in the Table Style Options group, select Header Row.
-
Right-click the table and select Table Properties.
-
In the Table Properties dialog, click the Row tab and then select Repeat as Header row at the top of each page.
To define a table column header in previous versions of Word:
-
Select the heading row or rows. The selection must include the first row of the table.
-
On the Table menu, click Heading Rows Repeat.
C.2.6 Defining a Table Row Header
To define multiple row headers, use the BI Publisher command:
<?acc-row-header:col_index?>
Example Usage:
<?acc-row-header:'1,2,4'?> ==> column 1, 2 and 4 will be row-headers.
<?acc-row-header:'1,4'?> ==> column 1 and 4 will be row-headers.
In Figure C-7, the code behind the ACC field is:
ACC Field=<?table-summary:'My Table Test '?><?acc-row-header:'1,2'?>
which defines the first two columns as row headers.
Figure C-7 First Two Columns as Row Headers

Description of "Figure C-7 First Two Columns as Row Headers"
C.2.7 Sample Supported Tables
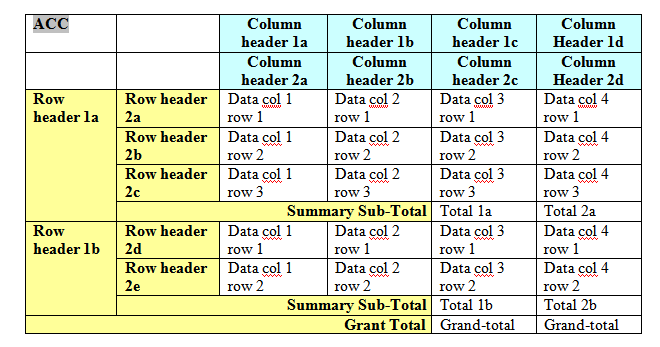
Figure C-8, Figure C-9, Figure C-10, and Figure C-11 display sample tables for which accessibility is supported.
Figure C-8 Supported Tables: Double Column and Row Headers

Description of "Figure C-8 Supported Tables: Double Column and Row Headers"
Figure C-9 Supported Tables: Group Summary Total

Description of "Figure C-9 Supported Tables: Group Summary Total"
Figure C-10 Supported Tables: Separated Row Headers with Shared Column Header

Description of "Figure C-10 Supported Tables: Separated Row Headers with Shared Column Header"
Figure C-11 Supported Tables: Separated Row Headers with Individual Column Header

Description of "Figure C-11 Supported Tables: Separated Row Headers with Individual Column Header"
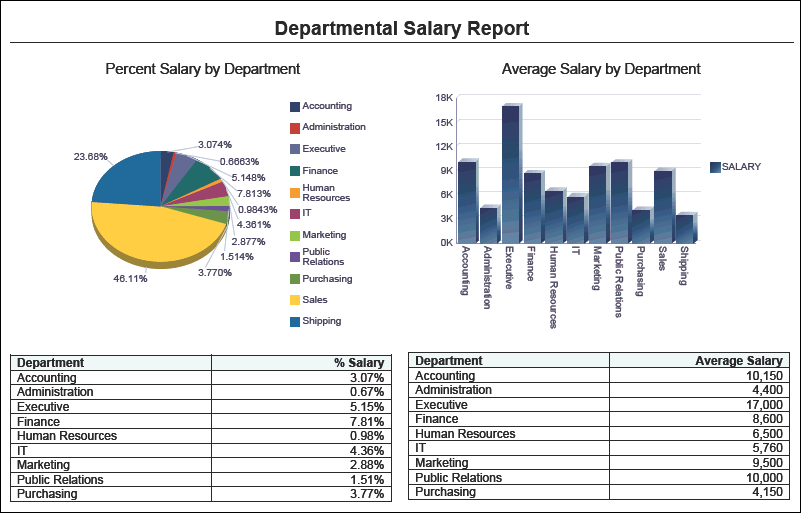
C.2.8 Converting Charts to Tables
Charts and gauges are not readable by the visually impaired. In order to make report output accessible for visually impaired users, create a table or cross tab that summarizes the data in the table as shown in Figure C-12. Ideally, the data is summarized at the same level as it is in the chart. Avoid providing a large table of detail data that is not summarized appropriately.
C.3 Designing Accessible Reports Using BI Publisher Layouts
This section describes the following techniques for designing accessible reports using the BI Publisher layout editor:
C.3.1 Defining Document Titles
You define the title of a report at the same time as you save the report layout. You can also rename the report at a later time.
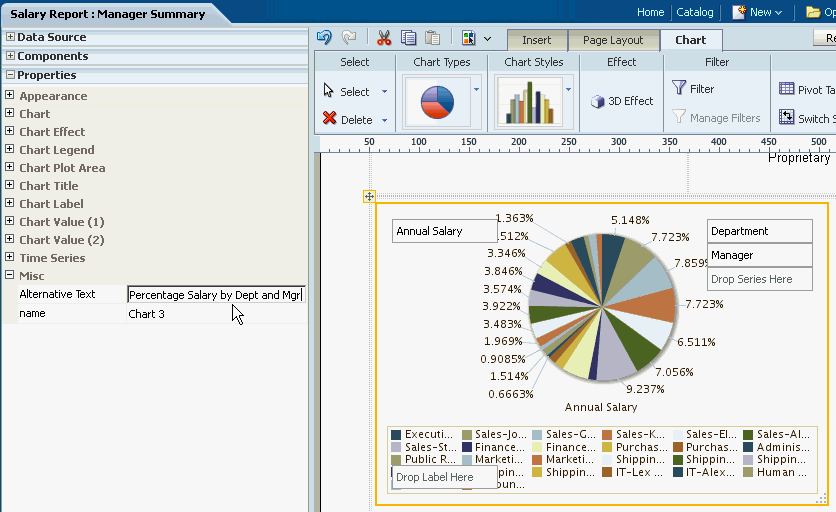
C.3.2 Defining Alternative Text for Images
You can define alternative text for images so that they are describable in accessibility mode.
To define alternative text for an image:
-
Select an image such as a chart.
-
On the Properties pane, expand Misc.
-
In the Alternative Text property, enter the alternative text for the image as shown in Figure C-13
C.3.3 Defining Summary Text for Tables
You can define a text summary to describe a table within a report.
To define summary table text:
-
Select a table.
-
On the Properties pane, expand Misc.
-
In the Summary property, enter the table summary text as shown in Figure C-14.
C.3.4 Defining Table Row Headers
Table row headers summarize each row in a table. The layout editor automically includes table row headers on all inserted tables. No further action is required.
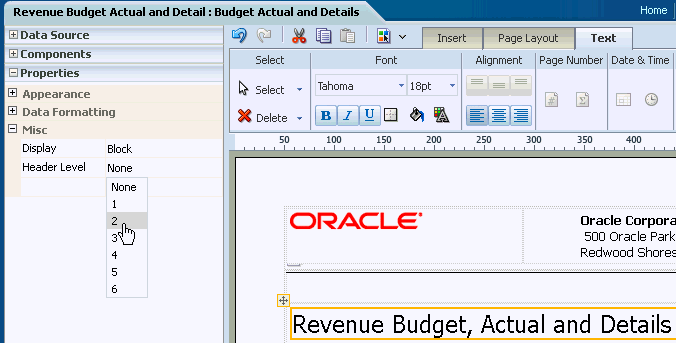
C.3.5 Defining Text Header Levels
You can define text header levels to specify structures within a report.
To define text header levels:
-
Select a text item.
-
On the Properties pane, expand Misc.
-
In the Header Level property, select a value 1 to 6 as shown in Figure C-15.


