6 Monitoring Content Server Status
This chapter describes serveral Content Server internal resources that are useful in monitoring the status of a Content Server instance.
This chapter includes thefollowing topics:
6.1 Viewing Content Server Status
You can view the current status (such as running or stopped) of the Content Server instance using two methods.
To view current status using Fusion Middleware Control:
-
In the navigation tree, expand the appropriate domain name (for example,
Content_base_domain). -
Expand WebCenter, then Content, then Content Server.
-
Select the Content Server instance name (for example,
Oracle WebCenter Content - Content Server (UCM_server1)). -
On the Content Server home page, you can view the current status of a Content Server instance.
To view current status using Content Server:
-
Choose Administration, then Admin Server.
-
Click Server Status.
6.2 Viewing Content Server Java Output
To view Java output from the Content Server instance:
-
Choose Administration, then Admin Server.
-
In the Admin Server page, click View Server Output.
-
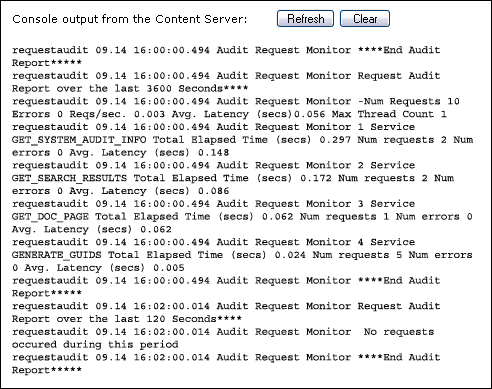
To refresh the output messages in the Admin Server Output page, click Refresh. To clear the output messages, click Clear.
6.3 Viewing Configuration Information
Oracle WebCenter Content provides a Configuration Information page that displays configuration information for the Content Server instance, which can be useful while troubleshooting a problem or working with the Oracle support organization.
To access the Configuration Information page:
-
Choose Admininstration, then Configuration for instance.
-
To display details, click the link for each type of configuration information.
Configuration information is provided for the following items:
-
Server name
-
Version
-
Class loader
-
Instance directory
-
Database type
-
Database version
-
HTTP server address
-
Mail server
-
Search engine name
-
Index engine name
-
Number of installed features
-
Number of enabled components
-
Number of disabled components
-
Auto number prefix
-
Use accounts
-
Ntlm security enabled
-
Allow get copy for user with read privilege
-
Allow only original contribute to check out
-
Java version
Note:
Some options are specified during the software installation, while other options are set using the System Properties utility.
-
6.4 Viewing System Audit Information
Oracle WebCenter Content provides a System Audit Information page for a Content Server instance, which can be useful when troubleshooting a problem or adjusting the Content Server's performance.
To access the System Audit Information page, choose Administration, then System Audit Information.
The System Audit Information page provides several types of information.
6.4.1 System Audit General Information
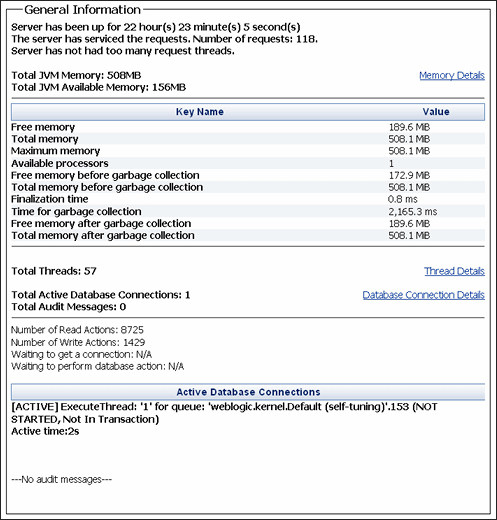
This section of the System Audit Information page lists:
-
Amount of time the Content Server instance has been up and running.
-
Number of service requests processed, and whether the system is handling services requests successfully. If the system is receiving too many requests, an email is sent to the system administrator regarding load performance.
-
Total JVM memory capacity and total JVM available memory. Also information about the memory usage for the system, which may be useful in troubleshooting any "out of memory" errors you might receive. This can be important when running the Content Server instance with many users and a large quantity of data.
-
Total number of threads, and information about which Java threads are currently running. This may be useful in determining the cause of an error.
-
Total number of active database connections, and information about database activity.
-
Total number of audit messages.
To display more information, click the link on the page for the type of configuration information. Figure 6-1 shows the general information with all links expanded.
Figure 6-1 System Audit General Information Page

Description of "Figure 6-1 System Audit General Information Page"
6.4.2 System Audit Localization Information
This section of the System Audit Information page lists:
-
String key count
-
Whether the Localization system is using a string index
-
Localization test run time
-
Localization test lookups per second
Figure 6-2 System Audit Localization Information Page

Description of "Figure 6-2 System Audit Localization Information Page"
6.4.3 System Audit Tracing Sections Information
This section of the System Audit Information page enables tracing in the Content Server instance and can be activated on a section-by-section basis. Tracing for active sections is displayed on the Server Output page. Section tracing can be useful for determining which section of the Content Server is causing trouble, or when you want to view the details of specific sections.
-
Click the Info icon next to the Tracing Sections Information heading to view a list with brief descriptions of sections available for tracing.
-
Select Full Verbose Tracing if you want to see in-depth tracing for any active section that supports it. For more information, see Section A.2.1.
-
Select Save to save the tracing information.
-
Use the Active Sections field to specify additional sections to trace by entering a comma-separated list of section names. The wildcard character * is supported so that using
schema*will trace all sections that begin with the prefixschema. -
Use the Event Trap Text field to specify what text to trap in the trace.
-
Select Add Thread Dump to add a thread dump to the trace.
Figure 6-3 System Audit Tracing Sections Information Page

Description of "Figure 6-3 System Audit Tracing Sections Information Page"
Important:
Any options set in Tracing Sections Information will be lost when the Content Server instance is restarted unless you enable Save and click Update.
6.4.4 System Audit Cache Information
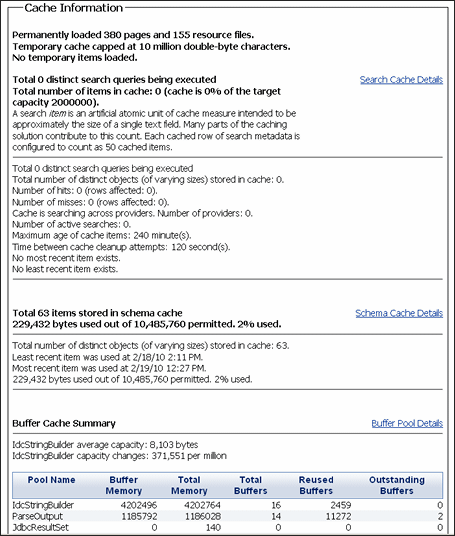
The Content Server instance caches various items for quick access. This section of the System Audit Information page displays current information for three caches:
-
Search cache: The number of permanently loaded pages and resource files. The number at which cache is temporarily capped. Whether any temporary items are loaded. Total number of distinct search queries being executed. Total number of distinct search queries being executed. These details are useful when troubleshooting any search related issues.
-
Schema cache: Total number of items stored in schema cache. Number of bytes used out of number permitted. Additional details of any schema objects currently in cache.
-
Buffer cache: Information about objects in cache and how much memory each object is using, which is reflected in the memory information of the System Audit General Information section. This information may be useful in pinpointing which object may be responsible for any memory leaks or other memory issues. (For information on troubleshooting, see Appendix A.
To display more information, click the link for the type of cache information on the page.
Figure 6-4 System Audit Cache Information Page

Description of "Figure 6-4 System Audit Cache Information Page"
6.4.5 System Audit Configuration Entry Information
This section of the System Audit Information page provides information on:
-
Number of environment keys
-
Number of overwritten config values
-
Number of ignored settings
-
Number of removed settings
To display more information, click Show for the type of configuration entry information on the page.
Figure 6-5 System Audit Configuration Entry Page

Description of "Figure 6-5 System Audit Configuration Entry Page"
6.4.6 System Audit Component Report Information
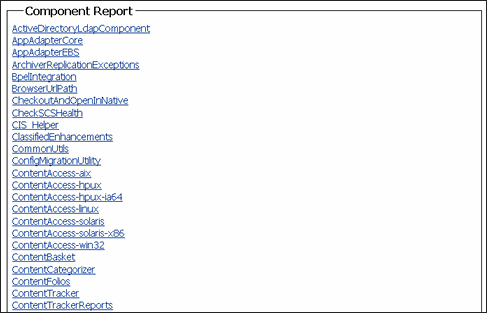
The Component Report Information section of the System Audit Information page lists Content Server components in alphabetical order by name. To display details about a component, click the component name in the list. Component details include:
-
Location: Pathname for the component in the instance
-
Version: Date, build, and revision number
-
Status: Current status of the component (Loaded or Skipped)
-
Reason: Explanation of the component status
Figure 6-6 System Audit Component Report Page

Description of "Figure 6-6 System Audit Component Report Page"
6.4.7 Server Output Page
The Server Output page displays the console output of the Content Server instance. This is the same information that is located in the DomainHome/ucm/cs/data/trace/classname.log file.
To view the Server Output page:
-
Choose Administration, then Admin Server.
-
Select View Server Output.
6.5 Monitoring Scheduled Jobs
Scheduled jobs run as part of events scheduled by system components. The Scheduled Jobs Administration interface can be used to monitor information about scheduled jobs on the Content Server instance.
6.5.1 Viewing Active Scheduled Jobs
To view active scheduled jobs:
-
Choose Administration, then Scheduled Jobs Administration, then Active Scheduled Jobs.
The job name, job description, processed date and time, current status, and available actions are listed for each scheduled job on the Active Scheduled Jobs page. The status icons represent High Priority, Inactive, Repeat, and Short.
-
Click Actions to select any of the following actions for a scheduled job:
-
Info: Display the Scheduled Jobs Information page.
-
Cancel: Cancel the scheduled job.
-
Edit: Edit the scheduled job.
-
Delete: Delete the scheduled job.
-
-
Click Info to display the Scheduled Jobs Information page.
6.5.2 Viewing Scheduled Jobs History
To view scheduled jobs history:
-
Choose Administration, then Scheduled Jobs Administration, then Scheduled Jobs History.
-
The Scheduled Jobs History page lists the job name, description, last process date, process status, and actions for each scheduled job.
6.5.3 Viewing and Modifying a Scheduled Job
To view and modify a scheduled job:
-
Choose Administration, then Scheduled Jobs Administration.
-
Choose either Active Scheduled Jobs or Scheduled Jobs History, then click Info for a specific job to view information. The job name, description, category, exception parent job, initial user, queue type, schedule type, current state, priority, interval, start token, progress status, create date, update date, process date, last processed date, and last processed status are displayed.
-
To display a Scheduled Jobs Information page that can be edited, choose Edit from the Actions menu on the Active Scheduled Jobs page.
-
To cancel or delete a scheduled job, choose Cancel or Delete from the Actions menu on the Scheduled Jobs Information page.
