39 Monitoring Oracle WebCenter Portal Performance
Fusion Middleware Control Console provides a Web-based user interface for monitoring the real-time performance of WebCenter Portal applications (Framework applications and Spaces applications), including any producers and portlets that WebCenter Portal applications may use.
Performance monitoring helps administrators identify issues and performance bottlenecks in their environment. This chapter describes the range of performance metrics available for WebCenter Portal applications and how to monitor them through Fusion Middleware Control. It also describes how to troubleshoot issues by analyzing information that is recorded in WebCenter Portal diagnostic log files.
Administrators who monitor WebCenter Portal applications regularly will learn to recognize trends as they develop and prevent performance problems in the future.
This chapter includes the following sections:
-
Section 39.1, "Understanding Oracle WebCenter Portal Performance Metrics "
-
Section 39.2, "Viewing Performance Information Using Fusion Middleware Control"
-
Section 39.3, "Customizing Key Performance Metric Thresholds and Collection for WebCenter Portal"
-
Section 39.4, "Diagnosing and Resolving Performance Issues with WebCenter Portal"
The content of this chapter is intended for Fusion Middleware administrators (users granted the Admin, Operator, or Monitor role through the Oracle WebLogic Server Administration Console). See also Section 1.8, "Understanding Administrative Operations, Roles, and Tools".
39.1 Understanding Oracle WebCenter Portal Performance Metrics
Through Fusion Middleware Control, administrators can monitor the performance and availability of all the components and services that make up WebCenter Portal applications, and the application as a whole. To access WebCenter Portal metrics through Fusion Middleware Control, see Section 39.2, "Viewing Performance Information Using Fusion Middleware Control".
To make best use of the information displayed it is important that you understand how performance metrics are calculated and what they mean. All WebCenter Portal's performance metrics are listed and described here for your reference. Some applications (such as Spaces applications) might use the full range of social networking, personal productivity, and collaboration service metrics listed, while others may only use one or more of these services.
This section includes the following subsections:
-
Section 39.1.1, "Understanding WebCenter Portal Metric Collection"
-
Section 39.1.3, "Using Key Performance Metric Data to Analyze and Diagnose System Health"
-
Section 39.1.4, "Understanding Some Common Performance Issues and Actions"
-
Section 39.1.10, "Understanding Page Response and Load Metrics"
39.1.1 Understanding WebCenter Portal Metric Collection
Performance metrics are automatically enabled for Oracle WebCenter Portal and display in Fusion Middleware Control. You do not need to set options or perform any extra configuration to collect performance metrics for your WebCenter Portal application. If you encounter a problem, such as, an application running slowly or hanging, you can find out more about the problem by investigating performance metrics, in real-time, through Fusion Middleware Control.
This section describes the different ways WebCenter Portal collects and presents metric data:
39.1.1.1 Metric Collection: Since Startup
At any given time, real-time metrics are available for the duration for which the WebLogic Server hosting your WebCenter Portal application is up and running. Real-time metrics that are collected or aggregated since the startup of the container are displayed on WebCenter Portal metric pages under the heading Since Startup. These metrics provide data aggregated over the lifetime of the WebLogic Server. The aggregated data enables you to understand overall system performance and compare the performance of recent requests shown in Recent History.
For example, consider a WebCenter Portal application deployed on a managed server that was started 4 hours ago. During that time, the WebCenter Portal application serviced 10,000 portlet requests with a total response time of 500, 000 ms. For this scenario, Since Startup metrics for portlets show:
-
Since Startup: Invocations (count) - 10000
-
Since Startup: Average Time (ms) - 50
Note:
Metric collection starts afresh after the container is restarted. Data collected before the restart becomes unavailable.
39.1.1.2 Metric Collection: Recent History
In addition to Since Startup metrics, WebCenter Portal reports metrics for requests serviced in the last 10 to 15 minutes as Recent History metrics. To do this, WebCenter Portal takes regular snapshots of real time metrics at an internal frequency. These metric snapshots are used to calculate the "delta" time spent performing service requests in the last 10 to 15 minutes and this data displays as Recent History metrics. Since Recent History metrics only aggregate data for the last 10-15 minutes, this information is useful if you want to investigate ongoing performance/availability issues.
If you compare Recent Metrics to Since Startup metrics you can gauge how the system characteristics have changed, compared to overall system availability/performance.
For example, consider a system that has been up and running for 2 days. During that time, WebCenter Portal recorded that the total time spent servicing 100, 000 portlet requests was 5 000 000 ms. The system starts to experience performance issues, that is, in the last 10-15 minutes, 100 portlet requests took a total time of 3 000 000 ms. In this scenario, the average response time reported "Since Startup" is quite low and would not indicate a performance issue (5 000 000ms/100 000 = 50ms). However, the same Recent History metric is considerably higher (3000000ms/100 = 30 seconds) which immediately tells the administrator that performance degraded recently. A quick comparison of "Recent History" with the corresponding "Since Startup" metric can clearly show whether or not the recent metric data is normal and in this case shows there is currently a problem with the system.
Recent History metrics can also help you prioritize which areas to investigate and which areas you can ignore when performance issues arise. For example, if an ongoing performance issue is reported and Recent History metrics for a particular service shows a value of 0, it indicates that the service has not been used in the last 10-15 minutes. Similarly, if the "Average Response Time" value is small and the "Invocation" count is low, the service may not be contributing to the performance problem. In such cases, administrators can investigate other services.
Typically, Recent History shows data for the most recent 10-15 minutes. However, there are situations when the data does not reflect the last 10-15 minutes:
-
If the WebLogic Server has just started up, and has been running for less than 10-15 minutes, then Recent History shows data for the duration for which the server has been up and running.
-
If one or more WebCenter Portal services are not accessed for an extended period of time, then older metric snapshots will slowly age out. In such cases, metric data is no longer available for the last 10-15 minutes so Recent History metrics cannot calculate the delta time spent in performing service requests that occurred in last 10-15 minutes. When this happens, the Recent History data can show the same values as the Since Startup metrics. When the service is used again, metric snapshots resume for the service. Once enough recent data is available, the Recent History metrics again start to display metrics for the last 10-15 minutes.
Most live environments are not idle for extended periods, so recent metric collection is rarely suspended due to inactivity. However, if you have a test environment that is used intermittently or not used for a while, you might notice recent metric collection stop temporarily, as described here.
39.1.1.3 Metric Collection: Last "N" Samples
Since Startup and Recent History metrics calculate performance over a specific duration, and show aggregated metrics for that duration. In addition to these, WebCenter Portal collects and reports per-request performance information for a range of key WebCenter Portal metrics. Such metrics allow you to look at the success and response time of each request individually, without considering previous requests. Out-of-the-box, the last 100 samples are used to calculate key metric performance/availability but you can increase or decrease the sample set to suit your installation.
For example, if 10 out of the last 100 page requests failed, page availability is calculated as 90%. If you reduce the sample set to 50 and 10 pages fail, page availability is reported to be 80%.
The examples show how the sample set size can effect the performance reports. The value you select is up to you but if you increase the number of samples, consider the additional memory requirements since the last "N" metric samples are maintained in memory. Oracle recommends a few hundred samples at most.
To change the number of samples used to report key performance metrics in your installation, see Section 39.3.6, "Configuring the Number of Samples Used to Calculate Key Performance Metrics".
To find out more about WebCenter Portal's key performance metrics and thresholds, refer to Section 39.1.2, "Understanding the Key Performance Metrics".
39.1.2 Understanding the Key Performance Metrics
Diagnosing the availability and performance of WebCenter Portal applications typically requires that you look at various important metrics across multiple components such as the JVM, the WebLogic Server, as well as the WebCenter Portal application.
To help you quickly identity and diagnose issues that can impact WebCenter Portal application performance, WebCenter Portal collects the last 'N' samples for a range of "key performance metrics" and exposes them in Fusion Middleware Control. To access key performance metric information for your application, see Section 39.2, "Viewing Performance Information Using Fusion Middleware Control".
Thresholds determine when a performance alert or warning is triggered. Allowing you to set threshold values that represent suitable boundaries for your WebCenter Portal system, ensures that you obtain relevant performance alerts in Enterprise Manager Fusion Middleware Control. When key performance metrics are "out of bounds" with respect to their configured thresholds they are easy to find in Fusion Middleware Control as they appear color-coded. For more information about thresholds, see Section 39.3, "Customizing Key Performance Metric Thresholds and Collection for WebCenter Portal".
You do not need to specifically set thresholds for metrics, such as "availabilty", that report success or failure. For example, document download failures automatically appear color coded "red" and successful downloads always appear "green".
WebCenter Portal allows you to manage warning thresholds for the key performance metrics described in Table 39-1:
Table 39-1 Key Performance Metric Collection
| Component | Key Performance Metric | Metric Sampling |
|---|---|---|
|
WebCenter Portal - Pages |
Page Response Time |
Per Request |
|
WebCenter Portal - Documents |
Download Throughput Acceptable Download Time |
Per Request |
|
WebCenter Portal - Documents |
Upload Throughput Acceptable Upload Time |
Per Request |
|
WebCenter Portal - Portlets |
Portlet Response Time |
Per Request |
|
WebCenter Portal - Application |
Active Sessions |
1 sample every X minutes |
|
JVM |
CPU Usage |
1 sample every X minutes |
|
JVM |
Heap Usage |
1 sample every X minutes |
|
JVM |
Garbage Collection Rate |
1 sample every X minutes |
|
JVM |
Average Garbage Collection Time |
1 sample every X minutes |
|
WebLogic Server |
Active Execute Threads |
1 sample every X minutes |
|
WebLogic Server |
Execute Threads Idle Count |
1 sample every X minutes |
|
WebLogic Server |
Hogging Execute Threads |
1 sample every X minutes |
|
WebLogic Server |
Open JDBC Sessions |
1 sample every X minutes |
WebCenter Portal captures end-user requests for pages, portlets, and documents and a metric sample is collected for each request. For example, if user A accesses page X, both the availability of page X (success/fail metric) and the response time of the request is captured by WebCenter Portal. Metric samples that take longer than a configured metric alert threshold or fail, show "red" in Fusion Middleware Control to immediately alert administrators when issues arise.
Other metrics, such as JVM and WebLogic Server metrics, are collected at a pre-defined frequency. Out-of-the-box, the sample frequency is 1 sample every 5 minutes but you can customize this value if required. For details, see Section 39.3.5, "Configuring the Frequency of WebLogic Server Health Checks".
The total number of samples that WebCenter Portal collects is configurable too, as described in Section 39.3.6, "Configuring the Number of Samples Used to Calculate Key Performance Metrics". The default sample set is 100 samples. Since there is a memory cost to maintain metric samples, do not specify an excessive number of samples; Oracle recommends a few hundred at most.
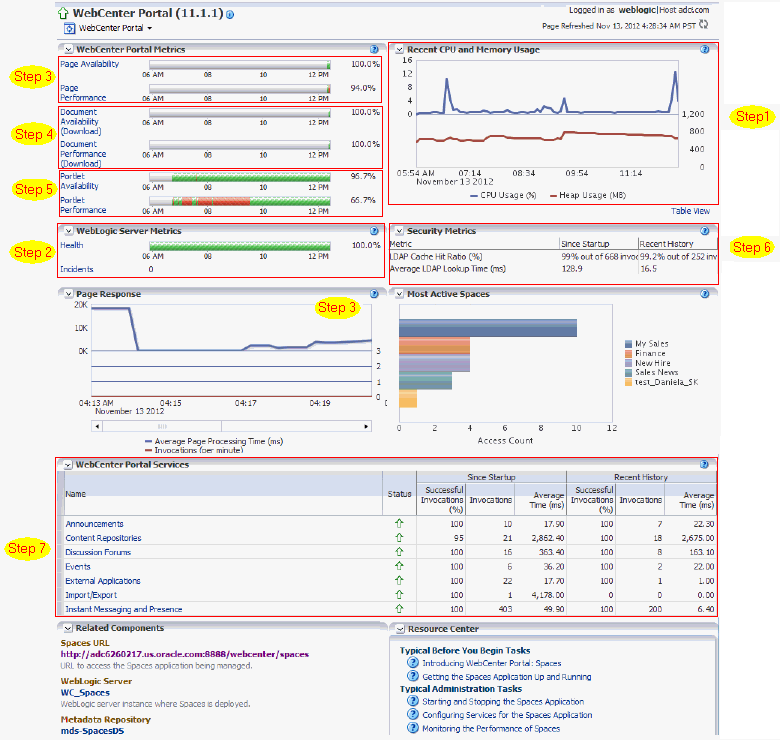
WebCenter Portal's key performance metrics are specifically selected to help administrators quickly identity and diagnose common issues that can impact WebCenter Portal application performance. You can view all key performance metric data from your WebCenter Portal application home page in Fusion Middleware Control.
39.1.3 Using Key Performance Metric Data to Analyze and Diagnose System Health
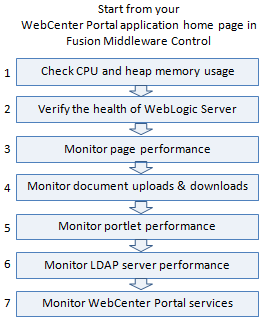
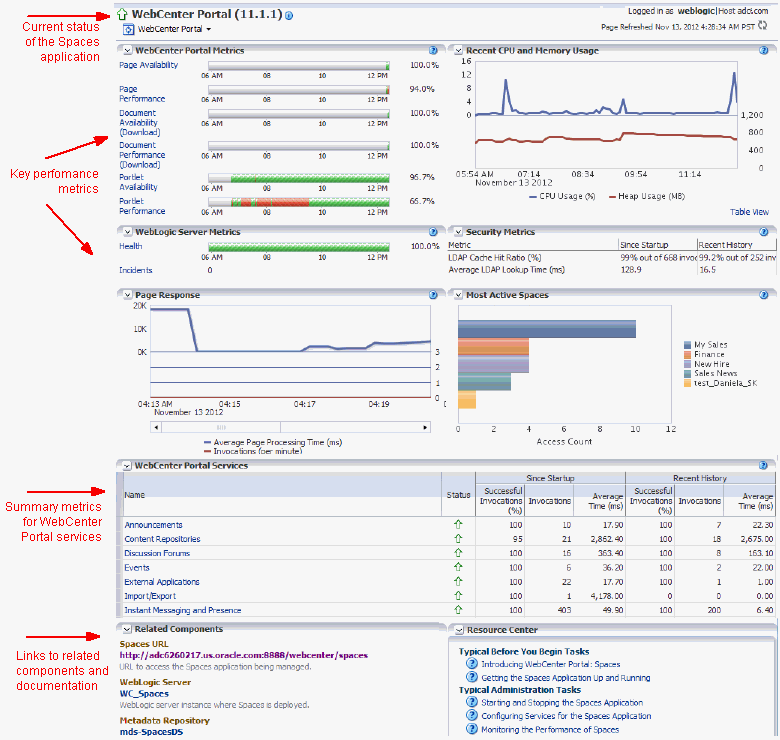
If you monitor your WebCenter Portal application regularly, you will learn to recognize trends as they develop and prevent performance problems in the future. The best place to start is your application's home page in Enterprise Manager Fusion Middleware Control. The home page displays status, performance, availability, and other key metrics for the various components and services that make up your WebCenter Portal application, as well as the WebLogic Server on which the application is deployed.
If you are new to WebCenter Portal, use the information in this section to better understand how to use the information displayed through Fusion Middleware Control to identify and diagnose issues.
Note:
-
Steps 4 and 5 only apply if your WebCenter Portal application utilizes portlets or document features.
-
Bar charts appear grey if a feature is not used.
-
Line charts require at least 3 data points before they start to show data.
Table 39-2 Analyzing System Health - Step by Step
| Step | Description |
|---|---|
|
Navigate to the home page for your WebCenter Portal application |
Use Enterprise Manager Fusion Middleware Control to monitor the performance of WebCenter Portal applications. The best place to start is your application's home page: |
|
1 Check CPU and heap memory usage |
Overall performance deteriorates when CPU or memory usage is too high so its important that you always look at the CPU and memory metrics before looking at any other WebCenter Portal-specific metric. Check the Recent CPU and Memory Usage charts to see the current usage trend:
See also, Section D.4.2.1, "Verifying System Resources (CPU and Memory)". Note: For Framework applications, select Application Deployment >WebCenter Portal >Recent WebLogic Server Metrics to display the Recent CPU and Memory Usage chart. Next Step: If the charts indicate that CPU and memory usages are normal, verify the health of the WebLogic Server. |
|
2 Verify the health of WebLogic Server |
Look in the WebLogic Server Metrics region:
The actions you take next depend on the metric data. For example, if there are hogging threads, you can take thread dumps. If JDBC connections are exceeding limits, you can analyze further for connection leaks. If the garbage collection rate is exceeding limits, you can take heap dumps, an so on. For details, see Section 39.1.8, "Understanding WebLogic Server Metrics" and Appendix D, "Troubleshooting WebCenter Portal Performance Issues". Out-of-bound metrics show "red" in charts and "orange" in the Health Metrics table. Examine all occurrences of such situations by scanning the diagnostic logs. In-memory information is limited to "N" metric samples, but the logs store much more historical information about how often a problem is happening, as well as additional contextual information, such as which user. Here is sample message: [WC_Spaces] [WARNING] [WCS-69252] [oracle.webcenter.system-management] [tid: oracle.webcenter.DefaultTimer] [ecid: 0000JhEX92mEgKG_Ix8Dyf1Ghz32000002,0] [APP: webcenter#11.1.1.4.0] wlsCpuUsage: 21.92100394175851 % of WebLogicServer is out-of-bounds Tip: You can use Fusion Middleware Control to locate all messages of this type by searching the message type, message code, and other string pattern details. See Section 39.5, "Viewing and Configuring Log Information". By default, a warning thresholds is only set for CPU Usage but you can configure thresholds for other key WebLogic Server metrics, such as Heap Memory Usage. See Section 39.3.3, "Configuring Thresholds for Key WebCenter Portal Metrics". Look at diagnostics logs for errors, failures, and any configuration or network issues. If an issue relates to another backend server, such as, WebCenter Content and SOA, verify the JVM/WebLogic Server health (CPU, heap, threads, and so on) for those managed servers too. Similarly, investigate WebLogic Server health for other managed servers in your WebCenter Portal installation such as WC_Portlet, WC_Utilities, and WC_Collaboration. Note: For Framework applications, select Application Deployment >WebCenter Portal >Recent WebLogic Server Metrics to display health metrics. Next Step: If the charts indicate that WebLogic Server is performing within thresholds, verify the health of your WebCenter Portal application. |
|
3 Monitor page performance |
Look at the WebCenter Portal Metrics section at the top of the Spaces home page. Review the page availability/performance charts to see whether page requests are currently responding as expected. Drill down to more detail to investigate issues relating to recent page requests. Use the Sort Ascending/Descending arrows for the Time and Page Name columns to see whether a pattern is emerging for a specific page or set of pages, or whether performance spikes appear to be more random. Out-of-bound metrics show "red" in charts and "orange" in the Page Metrics table. For details, see Section 39.1.5, "Understanding Page Request Metrics". Examine all occurrences of such situations by scanning the diagnostic logs. In-memory information is limited to "N" metric samples, but the logs store much more historical information about how often a problem is happening, as well as additional contextual information, such as which user. Here is sample message: [WC_Spaces] [WARNING] [WCS-69251] [oracle.webcenter.system-management] [tid: [ACTIVE].ExecuteThread: '4' for queue: 'weblogic.kernel.Default (self-tuning)'] [userId: weblogic] [ecid: 6356ef0164cbad47:3fe105c5:13b4e847973:-8000-0000000000000031,0] [APP: webcenter#11.1.1.4.0] [DSID: 0000JhEYRT^EgKG_Ix8Dyf1Ghz32000005] pageResponseTime: 22223 ms of PersonalSpace/Activities is out-of-bounds Tip: You can use Fusion Middleware Control to locate all messages of this type by searching the message type, message code, and other string pattern details. See Section 39.5, "Viewing and Configuring Log Information". Identify individual pages that are not performing. For details, see Section D.4.3, "How to Identify Slow Pages". Navigate to the "Overall Page Metrics" page to see how this page has performed historically (since startup, and last 10-15 minutes). Has it always been slow? For pages that are failing, see Section D.4.4, "How to Troubleshoot Slow Page Requests". Note: For Framework applications, select Application Deployment >WebCenter Portal >Recent Page Metrics to display page metrics. Next Step: If the charts indicate that page requests are performing within thresholds, verify document upload/download performance. |
|
4. Monitor document uploads and downloads |
Look at the WebCenter Portal Metrics section at the top of the Spaces home page. Review the document availability/performance charts to see whether document downloads are currently performing as expected. Drill down to more detail to investigate issues relating to recent document requests. Out-of-bound metrics show "red" in charts and "orange" in the Document Metrics table. For details, see Section 39.1.6, "Understanding Document Metrics". Examine all occurrences of such situations by scanning the diagnostic logs. In-memory information is limited to "N" metric samples, but the logs store much more historical information about how often a problem is happening, as well as additional contextual information, such as which user. Here is sample message: [WC_Spaces] [WARNING] [WCS-69255] [oracle.webcenter.system-management] [tid: [ACTIVE].ExecuteThread: '0' for queue: 'weblogic.kernel.Default (self-tuning)'] [userId: weblogic] [ecid: 6356ef0164cbad47:3fe105c5:13b4e847973:-8000-0000000000000060,0] [APP: webcenter#11.1.1.4.0] [DSID: 0000JhEYRT^EgKG_Ix8Dyf1Ghz32000005] downloadThroughput: 11.63793103448276 KB/sec of 3209 is out-of-bounds [WC_Spaces] [WARNING] [WCS-69254] [oracle.webcenter.system-management] [tid: [ACTIVE].ExecuteThread: '0' for queue: 'weblogic.kernel.Default (self-tuning)'] [userId: weblogic] [ecid: 6356ef0164cbad47:3fe105c5:13b4e847973:-8000-0000000000000249,0] [APP: wcportal] [DSID: 0000JhEbmszEgKG_Ix8Dyf1Ghz32000009] uploadThroughput: 95.90502106741573 KB/sec of OWCSVR01USORAC011587 is out-of-bounds Tip: You can use Fusion Middleware Control to locate all messages of this type by searching the message type, message code, and other string pattern details. See Section 39.5, "Viewing and Configuring Log Information". Navigate to the "Overall Service Metrics" page, and then select Content Repositories to see how documents have performed historically (since startup, and last 10-15 minutes). Have document performance deteriorated recently or always been slow? If document performance is normally within thresholds:
Note: For Framework applications, select Application Deployment >WebCenter Portal >Recent Document Metrics to display document metrics. Next Step: If the charts indicate that document requests are performing within thresholds, verify portlet performance. |
|
5. Monitor portlet performance |
Look at the WebCenter Portal Metrics section at the top of the Spaces home page. Review the portlet availability/performance charts to see whether portlets are currently performing as expected. Drill down to more detail to investigate issues relating to recent portlet requests. Out-of-bound metrics show "red" in charts and "orange" in the Portlet Metrics table. For details, see Section 39.1.7, "Understanding Portlet Producer Metrics". Out-of-bound conditions are also logged in managed server diagnostic logs so you can examine all historical events, that is, more that the most recent sample set that is held in memory. For example: [WC_Spaces] [WARNING] [WCS-69253] [oracle.webcenter.system-management] [tid: pool-3-daemon-thread-1] [userId: weblogic] [ecid: 6356ef0164cbad47:3fe105c5:13b4e847973:-8000-0000000000000088,0:16] [APP: webcenter#11.1.1.4.0] portletResponseTime: 20523 ms of Portlet: slowRenderingPortlet from Web Producer Myjpdk is out-of-bounds. Identify individual portlets or portlet producers that are not performing as expected. Navigate to the "Overall Service Metrics" page, and then select Portlet Producers or Portlets to see how these portlets/portlet producers have performed historically (since startup, and last 10-15 minutes). Has performance deteriorated recently or always been slow? If portlet performance is normally within thresholds:
For portlets that are failing, see "Troubleshooting Portlets" in Oracle Fusion Middleware Developer's Guide for Oracle WebCenter Portal. Note: For Framework applications, select Application Deployment >WebCenter Portal >Recent Portlet Metrics to display portlet metrics. Next Step: If the charts indicate that portlet requests are performing within thresholds, verify the performance of your LDAP server. |
|
6. Monitor LDAP server performance |
Look at the LDAP metrics in the Security section on the Spaces home page. When the server first starts up the cache hit ratio is zero and typically increases above 90% as the system warms up. For more information, see Section 39.1.9, "Understanding Security Metrics" and Section 18.6, "Configuring Cache Options for the Profile Service". Typically, the average LDAP lookup time is only a few milliseconds. If lookups are taking a long time there maybe a problem with the LDAP server or network relate issue.
To investigate further network issues, see Section D.4.2.6, "Diagnosing Network Related Problems Using tcpdump" or Section D.4.2.7, "Measuring Network Latency Using ping". If you are using Oracle Internet Directory, refer to "Oracle Internet Directory Performance Tuning" in Oracle Fusion Middleware Performance and Tuning Guide for advice on how to improve performance and avoid bottlenecks. For other LDAP servers, refer to the appropriate product documentation. Next Step: If your LDAP server is performing within thresholds, investigate some other WebCenter Portal services. |
|
7. Monitor individual services |
Look at the WebCenter Portal Services section at the bottom of the Spaces home page. For details, see Section 39.1.12, "Understanding Service Metrics". Quickly see if a particular service is "Down" or "Unknown". Refer to Section 39.1.12.3, "WebCenter Portal Service-Specific Issues and Actions" for guidance on possible causes and actions. Sort the table by Average Time or Invocations to prioritize which service to focus on. Click the name of a service to navigate to the "Overall Service Metrics" page. Compare Since Startup and Recent History metrics to see if performance deteriorated recently or always been slow. Note: For Framework applications, select Application Deployment >WebCenter Portal >Overall Service Metrics to display service metrics. |
39.1.4 Understanding Some Common Performance Issues and Actions
If a WebCenter Portal metric is out-of-bounds, do the following:
-
Check system resources, such as memory, CPU, network, external processes, or other factors. See also, Appendix D, "Troubleshooting WebCenter Portal".
-
Check other metrics to see if the problem is system-wide or only in a particular service.
-
If the issue is related to a particular service or component, then check if the back-end server is down or overloaded.
-
If the WebLogic Server has been running for a long time, compare the Since Startup metrics with the Recent History metrics to determine if performance has recently deteriorated, and if so, by how much.
-
When the status of a service is Down or some operations do not work, then validate, test, and ping the back-end server through direct URLs. For details, refer to the "Testing Connection" section in the relevant chapter. For a list of chapters, see Part IV, "Managing Services, Portlet Producers, and External Applications".
If you reconfigure connections to WebCenter Portal services you must always restart the managed server on which the WebCenter Portal application is deployed to pick up the changes. If key connection attributes change, such as a server's host/port details, connectivity to the server may be lost and the service may become unavailable until you reconfigure the connection and restart the managed server.
Note:
You can customize the threshold at which some key performance metrics trigger out-of-bound conditions. For more information, see Section 39.3, "Customizing Key Performance Metric Thresholds and Collection for WebCenter Portal".
39.1.5 Understanding Page Request Metrics
You can monitor the availability and performance of page requests for a WebCenter Portal application through Fusion Middleware Control. You can monitor recent page data and historical (overall) page data.
This section includes the following information:
Note:
The page request metrics discussed in this section are different from the Page service metrics discussed in Section 39.1.12.2.12, "Page Operation Metrics." Page service metrics monitor page related operations such as creating pages. Whereas the page request metrics described here monitor individual page view/display requests (do not include page edit operations).
39.1.5.1 Understanding Full Page and Partial Page Metrics
Performance data is collected for full page and partial page requests. Full page metrics do not include partial page metrics.
Partial page requests display only portions of the page. Therefore, you can monitor the performance of pages within a page. Partial page refresh behavior is called partial page rendering (PPR). PPR allows only certain components on a page to be rerendered without the need to refresh the entire page. A common scenario is when an output component displays what a user has chosen or entered in an input component. Similarly, a command link or button can cause another component on the page to be rerendered without refreshing the entire page.
Partial page rendering of individual components on a page only increases partial page metrics and does not cause any change in full page metrics. For example, a calendar refresh on a page increases partial page invocations by 1, but full page invocations remain unchanged.
For more information about PPR, see the chapter "Rerendering Partial Page Content" in the Oracle Fusion Middleware Web User Interface Developer's Guide for Oracle Application Development Framework.
39.1.5.2 Recent Page Metrics
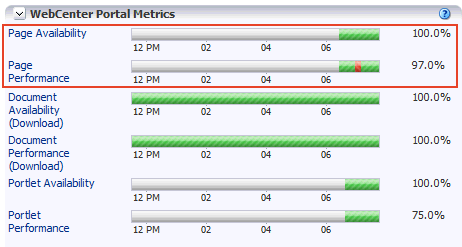
Recent page availability and performance metrics are summarized on the home page for your WebCenter Portal application (Figure 39-3 and Table 39-3). The page availability/performance charts show at a glance if page requests are slower than expected or failing.
Note:
To access the home page, see Section 6.2, "Navigating to the Home Page for the Spaces Application" or Section 6.3, "Navigating to the Home Page for Framework Applications".
The Page Availability and Page Performance charts report availability and performance over the last 'N' page requests (by default, "N" is 100). The time range starts with the earliest page/document/portlet request time and ends with the current time. See also, Section 39.3.6, "Configuring the Number of Samples Used to Calculate Key Performance Metrics".
The % value on the right shows the percentage of page requests that responded within a specific time limit. The percentage is calculated using information from the last "N" page requests. For example, if "N" is 100, and if 3 of the last 100 page requests exceeded the page response threshold, page performance is shown as 97%.
The bar chart status (green/red) does not change over time until the status changes, so the % performance value and the visual green/red ratio do not always match up. For example, consider a scenario where the first 5 page requests are "out of bounds", the system is idle (no page requests) for 9 hours, and then there are 95 "good" page requests within an hour. In this instance the chart displays 90% red (9 hours) and 10% green (1 hour) but the % performance value shows 95% ('N' is 100 and 95 samples out of 100 are "good"). The mismatch occurs because the bar charts plot uniformly over time, whereas page requests are not usually uniformly distributed over time.
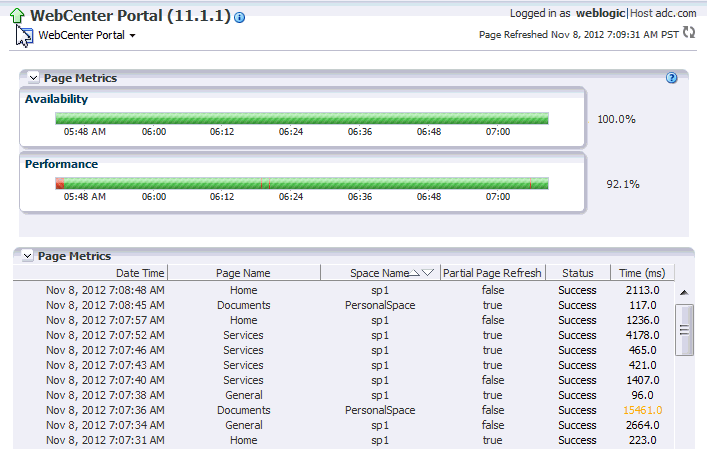
If the chart indicates issues or incidents, click the Page Availability or Page Performance link to navigate to more detailed information to diagnose the issue further (see Figure 39-4 and Table 39-3).
Use the information on the Recent Page Metrics page (Figure 39-4) to troubleshoot recent page performance issues. The page availability/performance charts at the top of the page show "red" if page requests are slower than expected or failing.
Note:
Out-of-the-box, the page response threshold is 10, 000ms so pages taking longer than 10, 000ms to respond show "red" in the chart. If this threshold is not suitable for your installation you can change the threshold value. See also, Section 39.3, "Customizing Key Performance Metric Thresholds and Collection for WebCenter Portal".
The charts report availability/performance over the last "N" page requests. The time range starts with the earliest page request time and ends with the time of the last page request.
Use the information in the table to identify slow pages, that is, the name of the page and the space to which the page belongs.
To diagnose page response issues, refer to the advice in "Step 3. Monitor page performance" in Table 39-2, "Analyzing System Health - Step by Step".
Table 39-3 Recent Page Request Metrics
| Metric | Description |
|---|---|
|
Availability |
Indicates page availability over the last "N" page requests:
|
|
Performance |
Indicates page performance over the last "N" page requests:
|
|
Date Time |
Date and time page requested. |
|
Page Name |
Name of the page requested. |
|
Space Name |
(Spaces application only) Name of the space in which the page is stored: |
|
Partial Page Refresh |
Indicates whether the page request refreshed the whole page ( |
|
Status |
Indicates whether the page request was successful (Success) or failed (Failure). Failure displays in orange text. |
|
Time (ms) |
Time taken to refresh the page (full or partial), in milliseconds. If the time exceeds the predefined page response threshold, the value displays in "orange". |
39.1.5.3 Overall Page Metrics
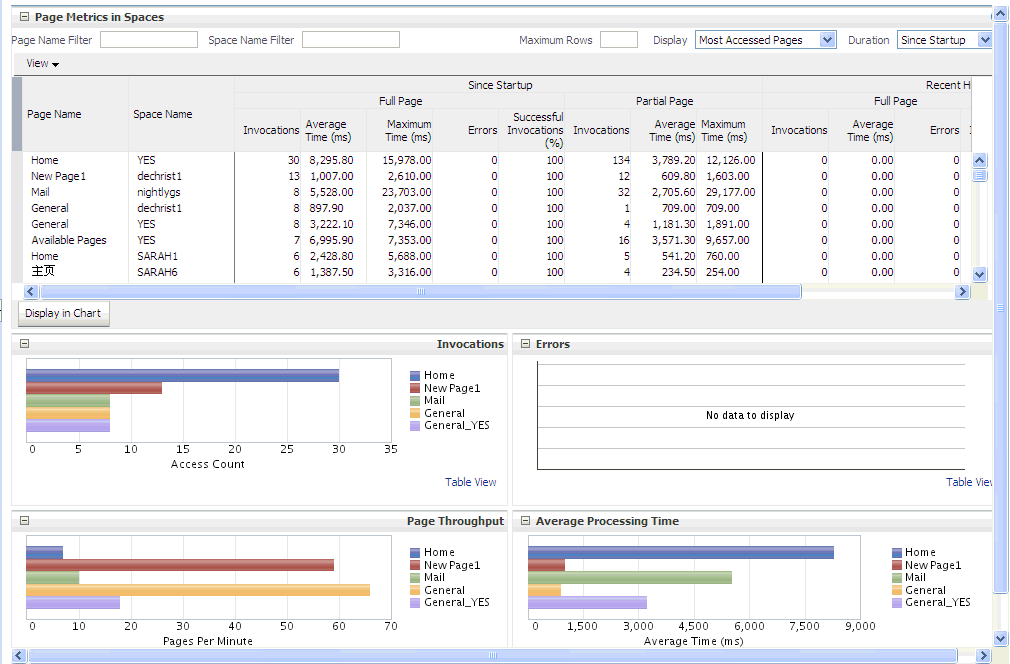
Historical performance metrics associated with page activity are also available as shown in Figure 39-5 and described in Table 39-4. This page displays metrics for both full and partial page requests and you can filter the data displayed to suit your requirements.
Note:
To access these metrics through Fusion Middleware Control, see Section 39.2, "Viewing Performance Information Using Fusion Middleware Control."
The table at the top of this page summarizes the status and performance of individual pages. Use the table to quickly see which pages are available, and to review their individual and relative performances.
Statistics become available when a page is created and are updated every time someone accesses and uses the page.
Note:
(Spaces application only) Metrics for pages in the Home space are not included.
Table 39-4 Page Request Metrics - Full Page and Partial Page
| Field | Description |
|---|---|
|
Display Options |
Filter the data displayed in the table:
The top five pages display in the chart. |
|
Page Name |
Names of pages that match your filter criteria (if any). If you do not specify filter criteria, all the pages are listed. |
|
Space Name |
(Space application only) Names of spaces that match your filter criteria (if any). If you do not specify filter criteria, pages from all spaces are listed. |
|
Invocations |
Total number of page invocations per minute (full or partial): - Since Startup - Recent History |
|
Average Time (ms) |
Average time (in ms) to display the page (full or partial): - Since Startup - Recent History |
|
Maximum Time (ms) |
Maximum time taken to display a page (full or partial): |
|
Errors (Only for full page) |
Number of errors occurred for a page per minute. |
|
Successful Invocations (Only for full page) |
Percentage of page invocations that succeeded: - Since Startup - Recent History If Successful Invocations (%) is below 100%, check the diagnostic logs to establish why page requests are failing. See, Section 39.5, "Viewing and Configuring Log Information." |
|
Pages per Minute |
Number of times the page is accessed per minute, also referred to as page throughput: - Since Startup - Recent History |
By default, the Pages Per Minute for full page metrics is hidden. To show this metric, go to the View menu > Columns > Since Startup/Recent History > Full Page > Pages Per Minute (Figure 39-6). Similarly, to hide columns that are not required, deselect the column names.
Figure 39-6 Pages Per Minute Option in the View Menu

Description of "Figure 39-6 Pages Per Minute Option in the View Menu"
Overall Page Request Metrics - Graphs
Use the graphs below the table to see, at a glance:
-
Invocations - Graph showing the most popular or least used pages, that is, pages recording the most or least invocations.
-
Page Throughput - Graph showing the average number of pages accessed per minute. Use this graph to identify pages with high (or low) hit rates.
-
Errors - (Spaces application only) Graph showing the number of errors. Use this graph to compare error rates.
-
Average Processing Time - (Spaces application only) Graph showing the average page response time (in milliseconds). Use this graph to identify pages with the best (or worst) performance.
-
Full Page Average Processing Time - (Framework applications only) Graph showing the average full page response time (in milliseconds). Use this graph to identify pages with the best (or worst) performance.
-
Partial Page Average Processing Time - (Framework applications only) Graph showing the average partial page response time (in milliseconds). Use this graph to identify pages with the best (or worst) page performance.
To compare a different set of pages:
-
Specify the appropriate filtering criteria in the Page Name Filter.
-
Select one or more pages in the table, and then click Display in Chart.
39.1.6 Understanding Document Metrics
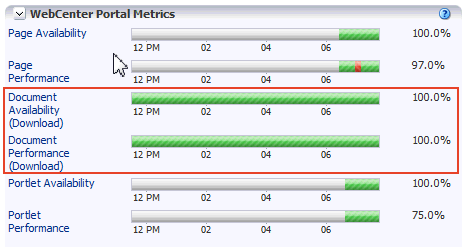
Recent document download availability and performance metrics are summarized on the home page for your WebCenter Portal application (Figure 39-7 and Table 39-5). The document availability/performance charts show at a glance if document download requests are slower than expected or failing
Note:
To access the home page, see Section 6.2, "Navigating to the Home Page for the Spaces Application" or Section 6.3, "Navigating to the Home Page for Framework Applications".
The Document Download Availability and Document Download Performance charts report availability and performance over the last "N" document download requests (by default, "N" is 100). The time range starts with the earliest page/document/portlet request time and ends with the current time. See also, Section 39.3.6, "Configuring the Number of Samples Used to Calculate Key Performance Metrics".
The % value on the right shows the percentage of document downloads that performed within set thresholds. The percentage is calculated using information from the last 'N' document download requests. For example, if "N" is 100, and if 3 of the last 100 document download requests are "out-of-bounds", document download performance is shown as 97%. For more information, see Table 39-5.
The bar chart status (green/red) does not change over time until the status changes, so the % performance value and the visual green/red ratio do not always match up. An explanation for this is provided in Section 39.1.5.2, "Recent Page Metrics" and the same applies to the document charts.
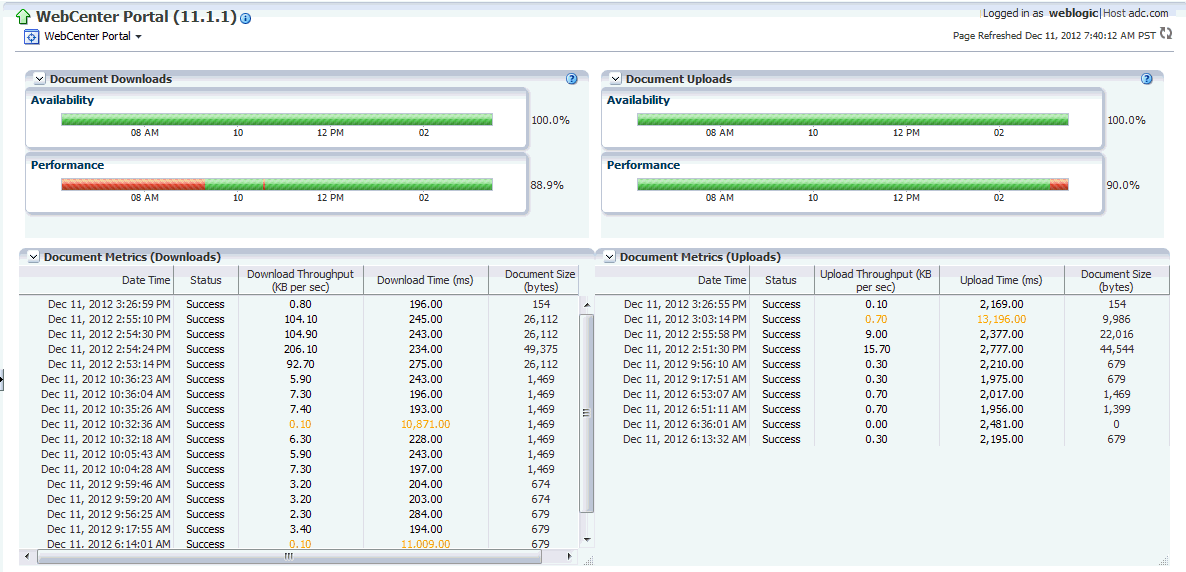
If the chart indicates issues or incidents, click the Document Availability or Document Performance link to navigate to more detailed information to diagnose the issue further (Figure 39-8 and Table 39-5).
Use the information on this page to troubleshoot recent, document-related performance issues. The document availability/performance charts at the top of the page indicate "red" if document upload or download requests are slower than expected or failing.
Note:
Out-of-the-box, the download threshold is 500ms and the upload threshold is 3, 000ms. Documents taking longer than this to download/upload show "red" in the chart if the download/upload throughput rate is less than 1024 or 180 KB/second respectively. If these thresholds are not suitable for your installation you can change the threshold value. See also, Section 39.3.4, "Configuring Thresholds for Document Upload/Download Metrics".
The charts report availability/performance checks results over the last "N" document download/upload requests. The time range starts with the earliest document request time and ends with the time of the last document request.
To diagnose document download/upload issues, refer to the advice in "Step 4. Monitor document uploads and downloads" in Table 39-2, "Analyzing System Health - Step by Step".
Table 39-5 Recent Document Metrics
| Metric | Description |
|---|---|
|
Availability |
Indicates document availability over the last "N" document download/upload requests:
|
|
Performance |
Indicates document performance over the last "N" document download/upload requests:
|
|
Date Time |
Date and time a document was uploaded/downloaded. |
|
Status |
Indicates whether the document upload/download operation was successful (Success) or failed (Failure). Failure displays in orange text. |
|
Download/Upload Throughput (KB per second) |
Amount of document data downloaded/uploaded per second. If the throughput fails to meet a predefined response, the value displays in "orange". |
|
Download/Upload Time (ms) |
Time taken to download/upload the document. |
|
Document Size (bytes) |
Size of the document (in bytes). Use the Sort Ascending/Sort Descending icons to analyze the performance by document size. |
39.1.7 Understanding Portlet Producer Metrics
You can monitor the availability and performance of all the portlets and portlet producers used by your WebCenter Portal applications through Fusion Middleware Control. You can monitor recent and historical (overall) portlet data. The following sections describe the metrics that are available:
39.1.7.1 Recent Portlet Metrics
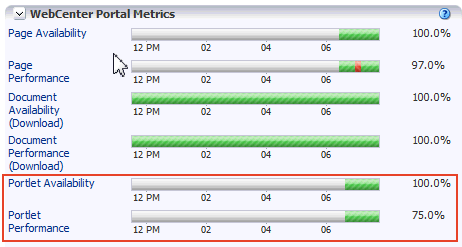
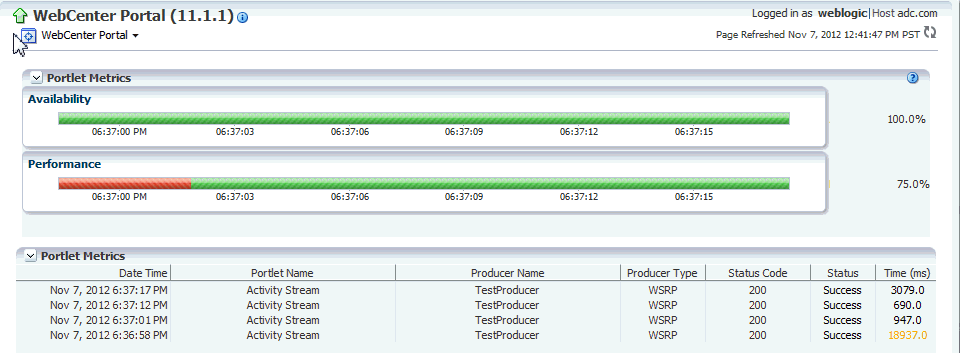
Recent portlet availability and performance metrics are summarized on the home page for your WebCenter Portal application (Figure 39-9 and Table 39-6). The portlet availability/performance charts show at a glance if portlet requests are slower than expected or failing.
Note:
To access the home page, see Section 6.2, "Navigating to the Home Page for the Spaces Application" or Section 6.3, "Navigating to the Home Page for Framework Applications".
The Portlet Availability and Portlet Performance charts report availability and performance over the last 'N' portlet requests (by default, 'N' is 100). The time range starts with the earliest page/document/portlet request time and ends with the current time. See also, Section 39.3.6, "Configuring the Number of Samples Used to Calculate Key Performance Metrics".
The % value on the right shows the percentage of portlet requests that responded within a specific time limit. The percentage is calculated using information from the last 'N' portlet requests. For example, if 'N' is 100, and if 25 of the last 100 portlet requests exceeded the portlet response threshold, portlet performance is shown as 75%. For more information, see Table 39-6.
The bar chart status (green/red) does not change over time until the status changes, so the % performance value and the visual green/red ratio do not always match up. An explanation for this is provided in Section 39.1.5.2, "Recent Page Metrics" and the same applies to the portlet charts.
If the chart indicates issues or incidents, click the Portlet Availability or Portlet Performance link navigate to more detailed information to diagnose the issue further (Figure 39-10 and Table 39-6).
Use the information on this page to troubleshoot recent portlet performance issues. The portlet availability/performance charts at the top of the page show "red" if portlet requests are slower than expected or failing.
Note:
Out-of-the-box, the portlet response threshold is 10, 000ms so portlets taking longer than 10, 000ms to respond show "red" in the chart. If this threshold is not suitable for your installation you can change the threshold value. For more information, see "Section 39.3, "Customizing Key Performance Metric Thresholds and Collection for WebCenter Portal".
The charts report availability/performance over the last 'N' portlet requests. The time range starts with the earliest portlet request time and ends with the time of the last portlet request.
Use the information in the table to identify slow portlets. You can determine the name of the portlet and the producer to which the portlets belongs.
To diagnose portlet issues, refer to the advice in "Step 5. Monitor portlet performance" in Table 39-2, "Analyzing System Health - Step by Step".
Table 39-6 Recent Portlet Metrics
|
Portlet Availability |
Indicates portlet availability over the last 'N' portlet requests:
|
|---|---|
|
Portlet Performance |
Indicates portlet performance over the last 'N' portlet requests:
|
|
Date Time |
Date and time of the portlet request. |
|
Portlet Name |
Name of the portlet requested. |
39.1.7.2 Overall Portlet Producer Metrics
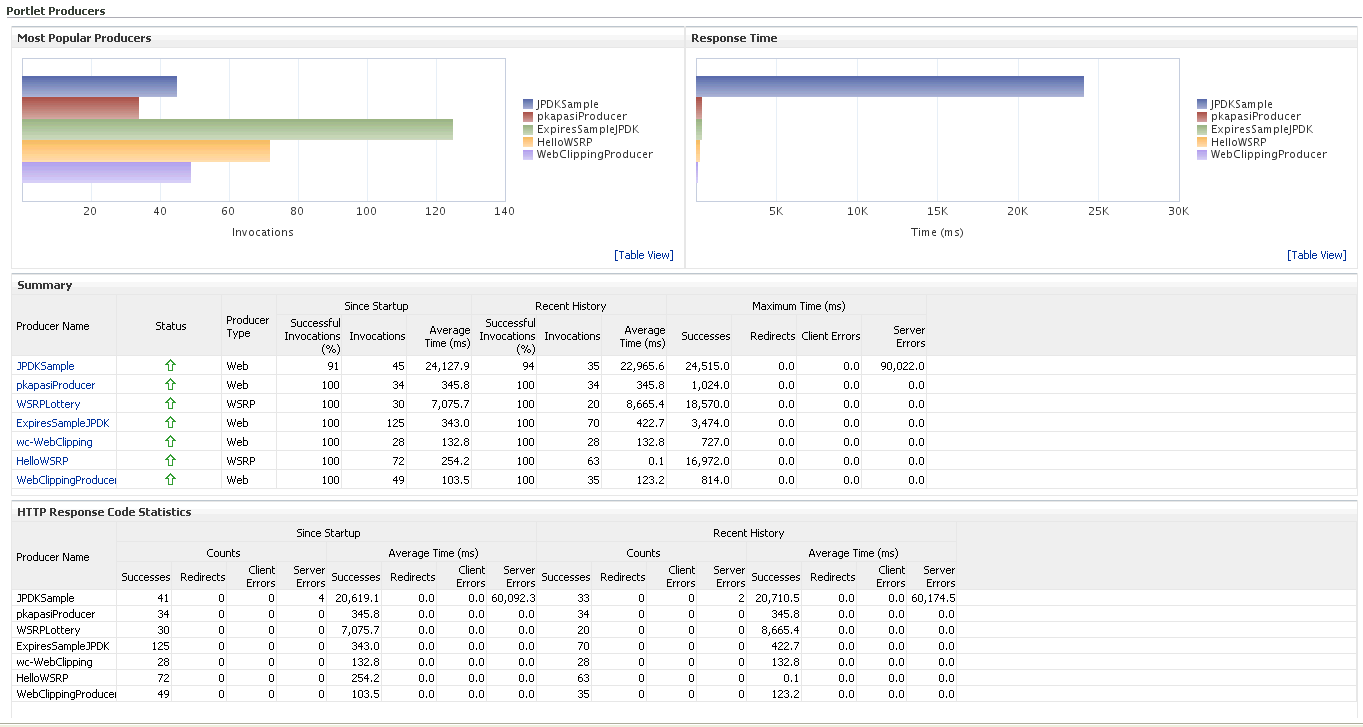
Historical performance metrics are also available for portlet producers used by your WebCenter Portal application, as shown in Figure 39-11. The information displayed on this page is described in the following tables:
Note:
To access these metrics through Fusion Middleware Control, see Section 39.2, "Viewing Performance Information Using Fusion Middleware Control."
Table 39-7 Portlet Producers - Summary
| Metric | Description |
|---|---|
|
Status |
The current status of portlet producers used in the WebCenter Portal application:
|
|
Successful Invocations (%) |
The percentage of portlet producer invocations that succeeded: - Since Startup - Recent History Any request that fails will impact availability. This includes WebCenter Portal application-related failures such as timeouts and internal errors, and also client/server failures such as requests returned with response codes HTTP4xx or HTTP5xx, responses with a bad content type, and SOAP faults, where applicable. If Successful Invocations (%) is below 100%, check the diagnostic logs to establish why service requests are failing. See, Section 39.5, "Viewing and Configuring Log Information." |
|
Invocations |
The number of portlet producer invocations per minute: - Since Startup - Recent History This metric measures each WebCenter Portal application-related portlet request and therefore, due to cache hits, errors, or timeouts on the application, this total may be higher than the number of actual HTTP requests made to the producer server. |
|
Average Time (ms) |
The average time taken to make a portlet request, regardless of the result: - Since Startup - Recent History |
Table 39-8 Portlet Producer - Detail
| Metric | Description |
|---|---|
|
Most Popular Producers |
The number of invocations per producer (displayed on a chart). The highest value on the chart indicates which portlet producer is used the most. The lowest value indicates which portlet producer is used the least. |
|
Response Time |
The average time each portlet producer takes to process producer requests since the WebCenter Portal application started up (displayed on a chart). The highest value on the chart indicates the worst performing portlet producer. The lowest value indicates which portlet producer is performing the best. |
|
Producer Name |
The name of the portlet producer being monitored. Click the name of a portlet producer to pop up more detailed information about each portlet that the application uses. See also Table 39-10, "Portlet - Detail". |
|
Status |
The current status of each portlet producer:
|
|
Producer Type |
The portlet producer type: Web or WSRP
|
|
Successful Invocations (%) |
The percentage of producer invocations that succeeded: - Since Startup - Recent History |
|
Invocations |
The number of invocations, per producer: - Since Startup - Recent History By sorting the table on this column, you can find the most frequently accessed portlet producer in your WebCenter Portal application. |
|
Average Time (ms) |
The average time taken to make a portlet request, regardless of the result: - Since Startup - Recent History Use this metric to detect non-functional portlet producers. If you use this metric with the Invocations metric, then you can prioritize which producer to focus on. |
|
Maximum Time (ms) |
The maximum time taken to process producer requests: - Successes - HTTP200xx response code - Re-directs - HTTP300xx response code - Client Errors - HTTP400xx response code - Server Errors - HTTP500xx response code |
39.1.7.3 Overall Portlet Metrics
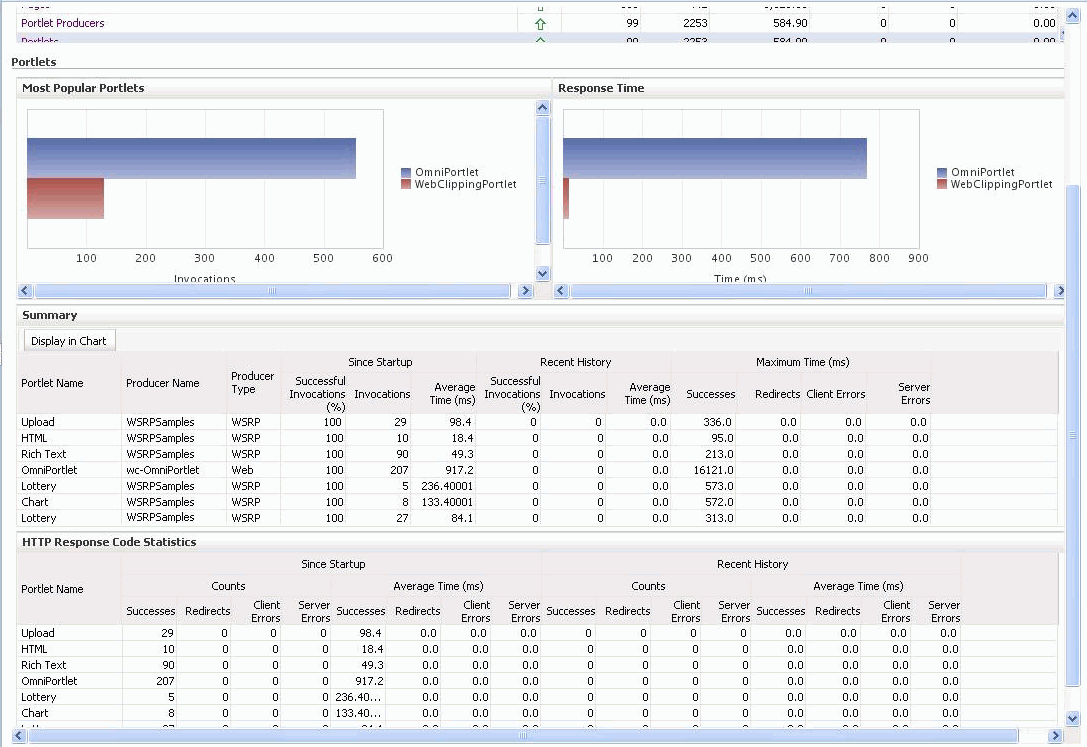
Historical performance metrics are available for individual portlets used by your WebCenter Portal application, as shown in Figure 39-12. The information displayed on this page is described in the following tables:
Note:
To access these metrics through Fusion Middleware Control, see Section 39.2, "Viewing Performance Information Using Fusion Middleware Control."
| Metric | Description |
|---|---|
|
Status |
The current status of portlets used in the WebCenter Portal application:
|
|
Successful Invocations (%) |
The percentage of portlet invocations that succeeded: - Since Startup - Recent History Any request that fails will impact availability. This includes WebCenter Portal application-related failures such as timeouts and internal errors, and also client/server errors. If Successful Invocations (%) is below 100%, check the diagnostic logs to establish why service requests are failing. See, Section 39.5, "Viewing and Configuring Log Information." |
|
Invocations |
The number of portlet invocations per minute: - Since Startup - Recent History This metric measures each WebCenter Portal application-related portlet request and therefore, due to cache hits, errors, or timeouts on the application, this total may be higher than the number of actual HTTP requests made to the portlet producer. |
|
Average Time (ms) |
The average time taken to process operations associated with portlets, regardless of the result: - Since Startup - Recent History |
| Metric | Description |
|---|---|
|
Most Popular Portlets |
The number of invocations per portlet (displayed on a chart). The highest value on the chart indicates which portlet is used the most. The lowest value indicates which portlet is used the least. |
|
Response Time |
The average time each portlet takes to process requests since the WebCenter Portal application started up (displayed on a chart). The highest value on the chart indicates the worst performing portlet. The lowest value indicates which portlet is performing the best. |
|
Portlet Name |
The name of the portlet being monitored. |
|
Status |
The current status of each portlet:
|
|
Producer Name |
The name of the portlet producer through which the portlet is accessed. |
|
Producer Type |
The portlet producer type: Web or WSRP
|
|
Successful Invocations (%) |
The percentage of portlet invocations that succeeded: - Since Startup - Recent History If Successful Invocations (%) is below 100%, check the diagnostic logs to establish why service requests are failing. See, Section 39.5, "Viewing and Configuring Log Information." |
|
Invocations |
The number of invocations, per portlet: - Since Startup - Recent History By sorting the table on this column, you can find the most frequently accessed portlet in your WebCenter Portal application. |
|
Average Time (ms) |
The average time each portlet takes to process requests, regardless of the result: - Since Startup - Recent History Use this metric to detect non-performant portlets. If you use this metric with the Invocations metric, then you can prioritize which portlet to focus on. |
|
Maximum Time (ms) |
The maximum time taken to process portlet requests: - Successes - HTTP200xx - Redirects - HTTP300xx - Client Errors - HTTP400xx - Server Errors - HTTP500xx The breakdown of performance statistics by HTTP response code can help you identify which factors are driving up the total average response time. For example, failures due to portlet producer timeouts would adversely affect the total average response time. |
Table 39-11 Portlet - HTTP Response Code Statistics
| Metric | Description |
|---|---|
|
Portlet Name |
The name of the portlet being monitored. |
|
Invocations Count - Successes - Redirects - Client Errors - Server Errors |
The number of invocations, by type (HTTP response code): - Since Startup - Recent History See also Table 39-12, "HTTP Response Codes". |
|
Average Time (ms) - Successes - Redirects - Client Errors - Server Errors |
The average time each portlet takes to process requests: - Since Startup - Recent History Use this metric to detect non-functional portlets. If you use this metric with the Invocations metric, then you can prioritize which portlet to focus on. |
Table 39-12 HTTP Response Codes
| HTTP Response and Error Code | Description |
|---|---|
|
200 -Successful Requests |
Portlet requests that return any HTTP2xx response code, or which were successful without requiring an HTTP request to the remote producer, for example, a cache hit. |
|
300 -Unresolved Redirections |
Portlet requests that return any HTTP3xx response code. |
|
400 -Unsuccessful Request Incomplete |
Portlet requests that return any HTTP4xx response code. |
|
500 -Unsuccessful Server Errors |
Portlet requests that failed for any reason, including requests that return HTTP5xx response codes, or which failed due to a WebCenter Portal application-related error, timeout, bad content type response, or SOAP fault. |
39.1.8 Understanding WebLogic Server Metrics
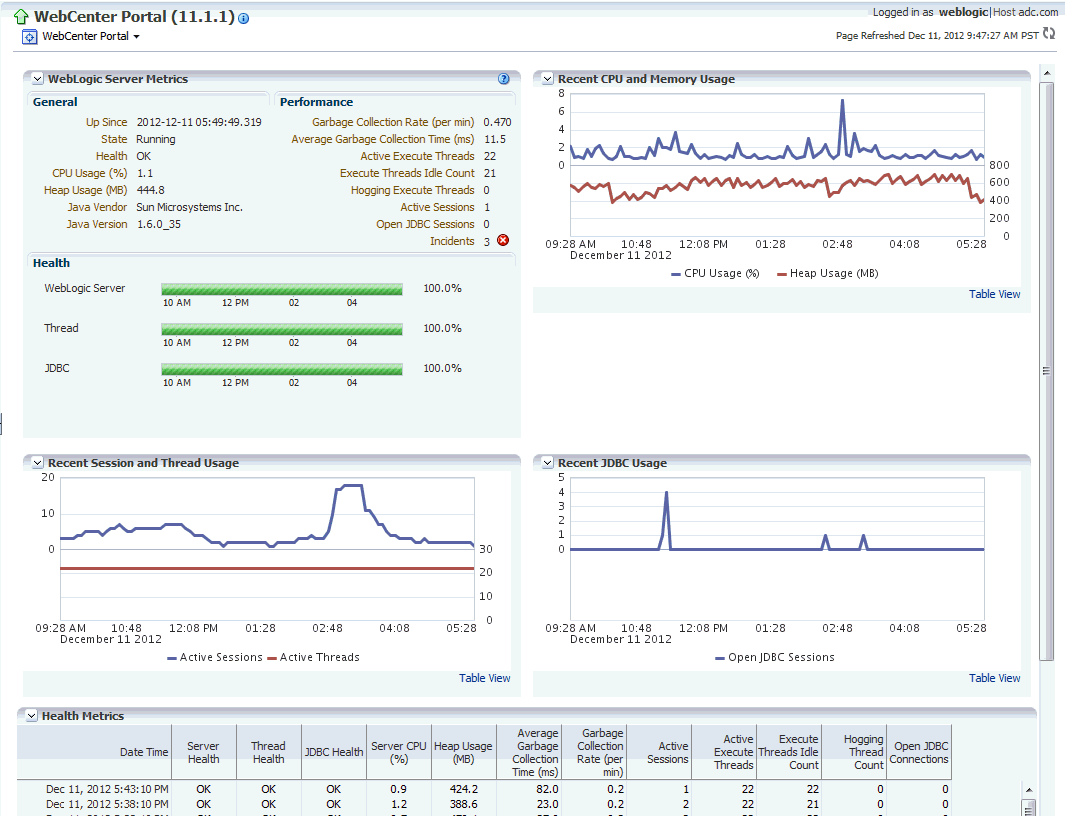
Recent WebLogic Server performance is summarized on the home page for your WebCenter Portal application (Figure 39-13 and Table 39-13). If the chart indicates issues or incidents, you can navigate to more detailed information to diagnose the issue further.
Note:
To access the home page, see Section 6.2, "Navigating to the Home Page for the Spaces Application" or Section 6.3, "Navigating to the Home Page for Framework Applications".
The charts report results from the last WebLogic Server 100 health checks. By default, metrics are recorded every five minutes so data collected over the last 8 hours can display here. If the server started up recently, the chart displays data from the time the server started to the current time.
Note:
If required, you can customize the metric collection frequency to better suit your installation. For details, see Section 39.3, "Customizing Key Performance Metric Thresholds and Collection for WebCenter Portal".
Table 39-13 Recent WebLogic Server Metrics on the Home Page
| Metric | Description |
|---|---|
|
Health |
Summarizes recent WebLogic Server health as reported by the Oracle WebLogic Server self-health monitoring feature. This metric considers recent server health, thread health, and JDBC health:
|
|
Incidents |
Number of times WebLogic Server metrics exceed threshold settings (that is, metrics such as CPU usage, memory usage, thread count, number of JDBC connections, session metrics, and so on). For example, if the metric data set contains 2 incidents where thread count exceeded the predefined threshold and the number of JDBC connections exceeded the threshold limit 3 times, then the number of incidents displayed is 5. When the number of incidents is greater than 0, an icon with a red cross displays. Click the Incidents link to drill down to the Recent WebLogic Server Metrics Page (Figure 39-13) and examine the Health Metrics table to diagnose the incidents further. |
You can click Health or Incidents to drill down to the Recent WebLogic Server Metrics Page (Figure 39-13). The metrics displayed on this page are described in the following sections:
WebLogic Server Metrics Section
| Metric | Description |
|---|---|
|
General |
|
|
Up Since |
Date and time the server last started up. |
|
State |
Current life cycle state of this server.For example, a server can be in a RUNNING state in which it can receive and process requests or in an ADMIN state in which it can receive only administrative requests. For more information, see "Understanding Server Life Cycle" in the Oracle Fusion Middleware Managing Server Startup and Shutdown for Oracle WebLogic Server. |
|
Health |
Health status of the server, as reported by the Oracle WebLogic Server self-health monitoring feature. For example, the server can report if it is overloaded by too many requests, if it needs more memory resources, or if it will soon fail for other reasons. For more information, see "Configure health monitoring," in the Oracle WebLogic Server Administration Console online help. |
|
CPU Usage (%) |
Percentage of the CPU currently in use by the Java Virtual Machine (JVM). This includes the load that the JVM is placing on all processors in the host computer. For example, if the host uses multiple processors, the value represents a snapshot of the average load on all the processors. |
|
Heap Usage (MB) |
Size of the memory heap currently in use by the Java Virtual Machine (JVM), in megabytes. |
|
Java Vendor |
Name of the company that provided the current Java Development Kit (JDK) on which the server is running. |
|
Java Version |
Version of the JDK on which the current server is running. |
|
Performance |
|
|
Garbage Collection Rate (per min) |
Rate (per minute) at which the Java Virtual Machine (JVM) is invoking its garbage-collection routine. By default, this metric shows the rate recorded in the last five minutes. See also, Section 39.3.5, "Configuring the Frequency of WebLogic Server Health Checks". |
|
Average Garbage Collection Time (ms) |
Average length of time (ms) the Java Virtual Machine spent in each run of garbage collection. The average shown is for the last five minutes. By default, this metric shows the average over the last five minutes. See also, Section 39.3.5, "Configuring the Frequency of WebLogic Server Health Checks". |
|
Active Execute Threads |
Number of active execute threads in the pool. |
|
Execute Threads Idle Count |
Number of idle threads in the pool. This count does not include standby threads or stuck threads. The count indicates threads that are ready to pick up new work when it arrives. |
|
Hogging Execute Threads |
Number of threads that are being held by a request right now. These threads will either be declared as stuck after a configured timeout or return to the pool. The self-tuning mechanism backfills if necessary. |
|
Active Sessions |
Number of active sessions for the application. |
|
Open JDBC Sessions |
Number of JDBC connections currently open. |
|
Incidents |
Number of times WebLogic Server metrics exceed threshold settings (that is, metrics such as CPU usage, memory usage, thread count, number of JDBC connections, session metrics, and so on). For example, if the metric data set contains 2 incidents where thread count exceeded the predefined threshold and the number of JDBC connections exceeded the threshold limit 3 times, then the number of incidents displayed is 5. When the number of incidents is greater than 0, an icon with a red cross displays. |
|
Health |
Summarizes recent health status, as reported by the Oracle WebLogic Server self-health monitoring feature. The Health charts report results from the last 100 performance checks. By default, metrics are recorded every five minutes so data collected over the last 500 minutes displays. If the server started up recently, the chart displays data from the time the server started to the current time.
|
|
WebLogic Server |
Reports recent WebLogic Server health checks. For example, if 10 out of the last 100 WebLogic Server health checks failed (not "OK"), WebLogic Server health is shown as 90%. |
|
Thread |
Reports recent thread health checks. For example, if 10 out of the last 100 WebLogic Server health checks report a thread health status other than "OK", WebLogic Server thread health is shown as 90% Some example thread health failures include:
|
|
JDBC |
Reports recent JDBC health checks. For example, the server can report too many JDBC connection requests. If 10 out of the last 100 WebLogic Server health checks report a JDBC health status other than "OK", WebLogic Server JDBC health is shown as 90%. |
Recent CPU and Memory Usage Section
This graph charts CPU and memory utilization for the Java Virtual machine over the the last 100 health checks.The time range starts with the earliest health check and ends with the time of the last health check.
From this performance graph, you will be able to tell how much of the memory/CPU configured for the virtual machine is actually being used and whether the trend is increasing. This might reveal to you that the applications running inside that virtual machine need more memory than the virtual machine has been assigned and that adding more memory to the virtual machine -- assuming that there is sufficient memory at the host level -- might improve performance. Similarly, you can assess whether additional CPU resources are required.
| Metric | Description |
|---|---|
|
CPU Usage (%) |
Percentage of the CPU currently in use by the Java Virtual Machine (JVM). This includes the load that the JVM is placing on all processors in the host computer. For example, if the host uses multiple processors, the value represents a snapshot of the average load on all the processors. |
|
Heap Usage (MB) |
Size of the memory heap currently in use by the Java Virtual Machine (JVM), in megabytes. |
Recent Session and Thread Usage Section
This graph charts the number of active sessions and active threads recorded over the last 100 health checks.The time range starts with the earliest health check and ends with the time of the last health check.
The number of active sessions and threads should rise and fall with the load on your system. If the graph shows a sudden rise or the number of sessions or threads keep increasing, investigate the issue further to understand what triggered the change in behavior.
| Metric | Description |
|---|---|
|
Active Sessions |
Number of active sessions for the application. |
|
Active Thread |
Number of active threads for the application. |
This graph charts the number of open JDBC sessions recorded over the last 100 health checks. The time range starts with the earliest health check and ends with the time of the last health check.
The Current Active Connection Count metric across all the data sources belonging to the server are used to calculate the overall open JDBC session count displayed here.
Use this chart to determine the number of JDBC sessions being used and to see whether the system is leaking JDBC resources. You can use the information in this chart to assess whether JDBC configuration or the connection pool size needs to be adjusted.
See also, Section D.4.2.4, "Verifying Connection Pool Settings".
This table displays data from the last 100 WebLogic Server health metrics collected, as reported by the Oracle WebLogic Server self-health monitoring feature.
| Metric | Description |
|---|---|
|
Date Time |
Date and time of the WebLogic Server health check. |
|
Server Health |
Sever health status, as reported by the Oracle WebLogic Server self-health monitoring feature. Successful health checks return "OK". Unsuccessful health checks report various failures, for example, the server can report if it is overloaded by too many requests, if it needs more memory resources, or if it will soon fail for other reasons. For more information, see "Configure health monitoring," in the Oracle WebLogic Server Administration Console online help. |
|
Thread Health |
Thread health status, as reported by the Oracle WebLogic Server self-health monitoring feature. Successful health checks return "OK". Unsuccessful thread checks report various failures, for example, if all the threads in the default queue become stuck, server health state changes to "CRITICAL". If all threads in For more information, see "Configure health monitoring," in the Oracle WebLogic Server Administration Console online help. |
|
JDBC Health |
JDBC health status, as reported by the Oracle WebLogic Server self-health monitoring feature. Successful health checks return "OK". Unsuccessful JDBC checks report various failures, for example, if the server reports too many JDBC connection requests or that more memory resources are required, server health state changes to "WARNING". For more information, see "Configure health monitoring," in the Oracle WebLogic Server Administration Console online help. |
|
Server CPU (%) |
If you are using the Oracle JRocket JDK, this metric shows the percentage of the CPU currently in use by the Jave Virtual Machine (JVM). This includes the load that the JVM is placing on all processors in the host computer. For example, if the host uses multiple processors, the value represents a snapshot of the average load on all the processors. |
|
Heap Usage (MB) |
Total heap memory (in MB) currently in use by the JVM. |
|
Average Garbage Collection Time (ms) |
Average length of time (ms) the Java Virtual Machine spent in each run of garbage collection. The average shown is for the last five minutes. By default, this metric shows the average over the last five minutes. See also, Section 39.3.5, "Configuring the Frequency of WebLogic Server Health Checks". |
|
Garbage Collection Rate (per min) |
Rate (per minute) at which the Java Virtual Machine (JVM) is invoking its garbage-collection routine. By default, this metric shows the rate recorded in the last five minutes. See also, Section 39.3.5, "Configuring the Frequency of WebLogic Server Health Checks". |
|
Active Sessions |
Number of active sessions for the application. |
|
Active Execute Threads |
Number of active execute threads in the pool. |
|
Execute Threads Idle Count |
Number of idle threads in the pool. This count does not include standby threads or stuck threads. The count indicates threads that are ready to pick up new work when it arrives. |
|
Hogging Thread Count |
Number of threads that are being held by a request right now. These threads will either be declared as stuck after a configured timeout or return to the pool. The self-tuning mechanism backfills if necessary. |
|
Open JDBC Connections |
Number of JDBC connections currently open. |
39.1.9 Understanding Security Metrics
Some key security-related performance metrics are displayed on the home page for your WebCenter Portal application (Figure 39-15 and Table 39-14).
Note:
To access the home page, see Section 6.2, "Navigating to the Home Page for the Spaces Application" or Section 6.3, "Navigating to the Home Page for Framework Applications".
If you compare Since Startup metrics with Recent History metrics you can determine whether performance has recently deteriorated, and if so, by how much.
| Metric | Description |
|---|---|
|
LDAP Cache Hit Ratio (%) |
Percentage of LDAP searches that result in a cache hit. WebCenter Portal caches user profiles to improve performance. By default, 1000 profiles are cached and to keep the cache fresh, any cached profile that is not accessed within 60 seconds is thrown out of the cache. After your system has warmed up and the cache populated, this metric should be close to 100%. Under typical conditions, cache hit ratios are above 90%. If the hit ratio is less than 90 percent, consider increasing the length of time profile information is stored in the cache and/or the increase the number of profile objects that can live in the cache using the WLST commands " For more information, see "Section 18.6, "Configuring Cache Options for the Profile Service". Note: The hit ratio is always low after a system restart and gradually rises as users access the WebCenter Portal application. |
|
Average LDAP Lookup Time (ms) |
Average time to complete an LDAP search request: - Since Startup - Recent HistoryFoot 1 If LDAP searches are taking too long, its most likely an issue on the LDAP server that is causing slow response times. If you are using Oracle Internet Directory, refer to "Oracle Internet Directory Performance Tuning" in Oracle Fusion Middleware Performance and Tuning Guide for advice on how to improve performance and avoid bottlenecks. For other LDAP servers, refer to the appropriate product documentation. |
Footnote 1 The last 10-15 minutes of data is used to calculate recent performance metrics. For details, see "WebCenter Portal Metric Collection: Recent History and Since Startup".
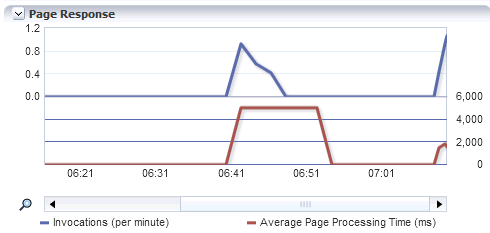
39.1.10 Understanding Page Response and Load Metrics
The page response chart on your application's home page (Figure 39-15) shows you how quickly WebLogic Server is responding to page requests and how many requests are being processed (its load).
The average page processing time (in ms) for all spaces, is calculated over a 15 minute period. The number of invocations per minute is also displayed to help you determine whether the average page processing time is increasing or decreasing. If slower page processing times are due to a large number of users accessing the system, an increase in invocations per minute will display on the graph. If the number of users has not increased (the invocations per minute graph is not increasing or fluctuating), then slower page processing times are most likely due to machine resource issues or lack of JVM resources (low memory, contention for database connections, and so on).
Click Table View to see detailed the response and load values, recorded at 5 minute intervals.
Note:
To access the home page, see Section 6.2, "Navigating to the Home Page for the Spaces Application" or Section 6.3, "Navigating to the Home Page for Framework Applications".
If you compare Since Startup metrics with Recent History metrics (last 15 minutes), you can determine whether performance has recently deteriorated, and if so, by how much.
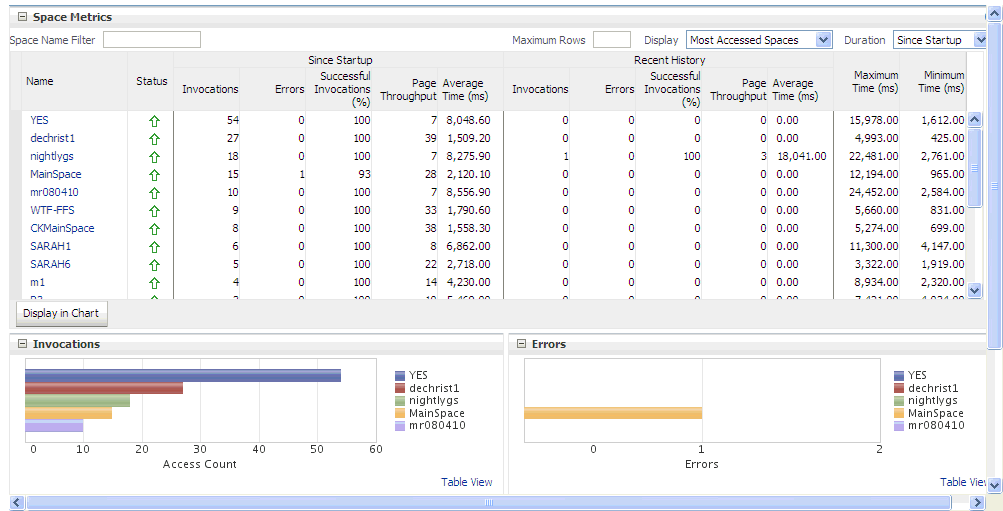
39.1.11 Understanding Space Metrics
(Spaces application only) You can view live performance metrics for individual spaces through Fusion Middleware Control, as shown in Figure 39-17. The metrics displayed on this page are described in Table 39-15 and Section 39.1.12.1, "Common WebCenter Portal Service Metrics."
Note:
Metrics for the Home space are not included.
To monitor these metrics through Fusion Middleware Control, see Section 39.2, "Viewing Performance Information Using Fusion Middleware Control."
The table at the top of this page summarizes the status and performance of individual spaces. Use the table to quickly see which spaces are up and running, and to review their individual and relative performances.
Statistics become available when a space is created and are updated every time a member accesses and uses the space.
You can filter the data displayed in the following ways:
-
Space Name Filter - Enter a full or partial search term, and then click the Refresh icon to refresh the list with all spaces for which a match is found in the display name. To display metrics for all spaces, clear the search term and click Refresh again.
-
Maximum Rows - Restrict the total number of spaces displayed in the table.
-
Display - Display metrics for the most popular spaces, the slowest spaces, or the spaces experiencing the most errors. Depending on you selection, the table orders spaces by:
- Number of Invocations (Most Accessed Spaces)
- Average Page Processing Time (Slowest Spaces)
- Number of Errors (Spaces with Most Errors)
-
Duration - Display metric information collected since startup or in the last 15 minutes (Recent History).
The top five spaces display in the chart.
| Metric | Description |
|---|---|
|
Name |
Names of spaces that match your filter criteria (if any). If you do not specify filter criteria, all the spaces are listed. |
|
Status |
Current status of each space:
|
|
Invocations |
Total number of space invocations: - Since Startup - Recent History |
|
Errors |
Number of errors recorded per minute. |
|
Successful Invocations (%) |
Percentage of space invocations that succeeded: - Since Startup - Recent History If Successful Invocations (%) is below 100%, check the diagnostic logs to establish why space requests are failing. See, Section 39.5, "Viewing and Configuring Log Information." |
|
Page Throughput |
The average number of pages processed per minute for each space: - Since Startup - Recent History |
|
Average Time (ms) |
The average time (in ms) to display pages in the space: - Since Startup - Recent History |
|
Maximum Time (ms) |
Maximum time taken to display a page in the space. |
|
Minimum Time (ms) |
Minimum time taken to display a page in the space. |
Use the graphs below the table to see, at a glance:
-
Invocations - Graph showing the most active/popular spaces, that is, spaces recording the most invocations.
-
Page Throughput - Graph showing the average number of pages accessed per minute for each space. Use this graph to identify spaces with high (or low) page hit rates.
-
Average Processing Time - Graph showing the average page response time (in milliseconds). Use this graph to identify spaces with the best (or worst) page performance.
-
Errors - Graph showing which spaces are reporting the most errors. Use this graph to compare error rates.
To compare a different set of spaces:
-
Specify the appropriate filtering criteria.
-
Select one or more spaces in the table, and then click Display in Chart.
39.1.12 Understanding Service Metrics
This section includes the following subsections:
-
Section 39.1.12.1, "Common WebCenter Portal Service Metrics"
-
Section 39.1.12.2, "WebCenter Portal Service-Specific Metrics"
-
Section 39.1.12.3, "WebCenter Portal Service-Specific Issues and Actions"
-
Section 39.1.4, "Understanding Some Common Performance Issues and Actions"
39.1.12.1 Common WebCenter Portal Service Metrics
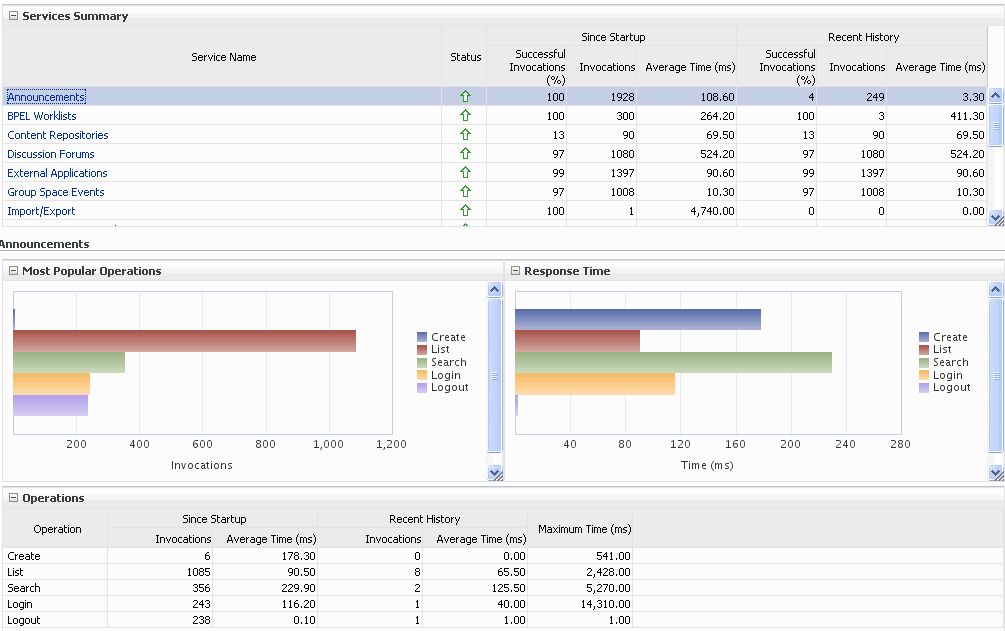
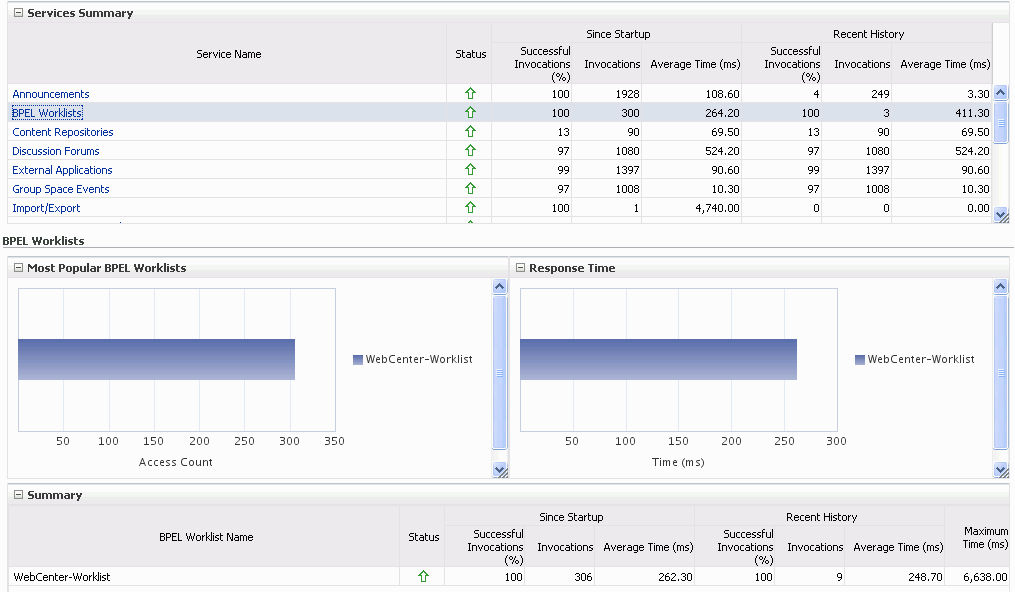
Fusion Middleware Control provides capabilities to monitor performance of WebCenter Portal services in the following ways:
-
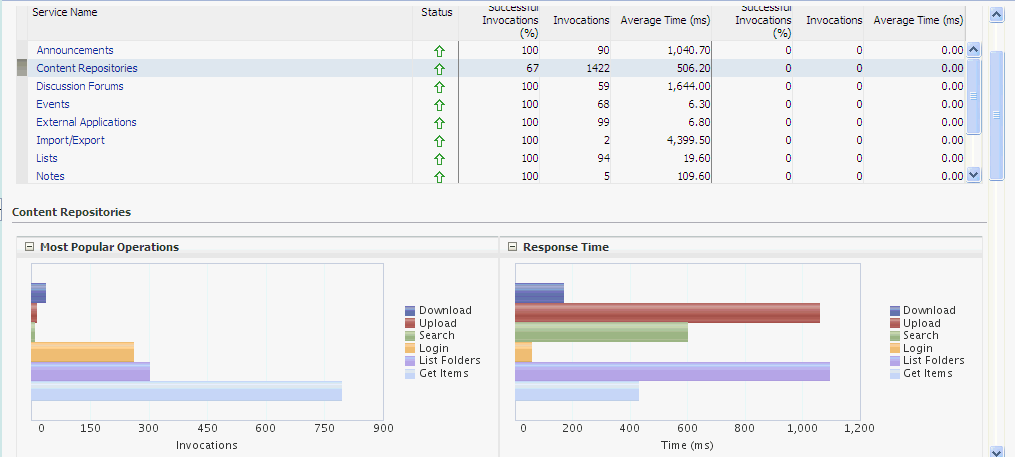
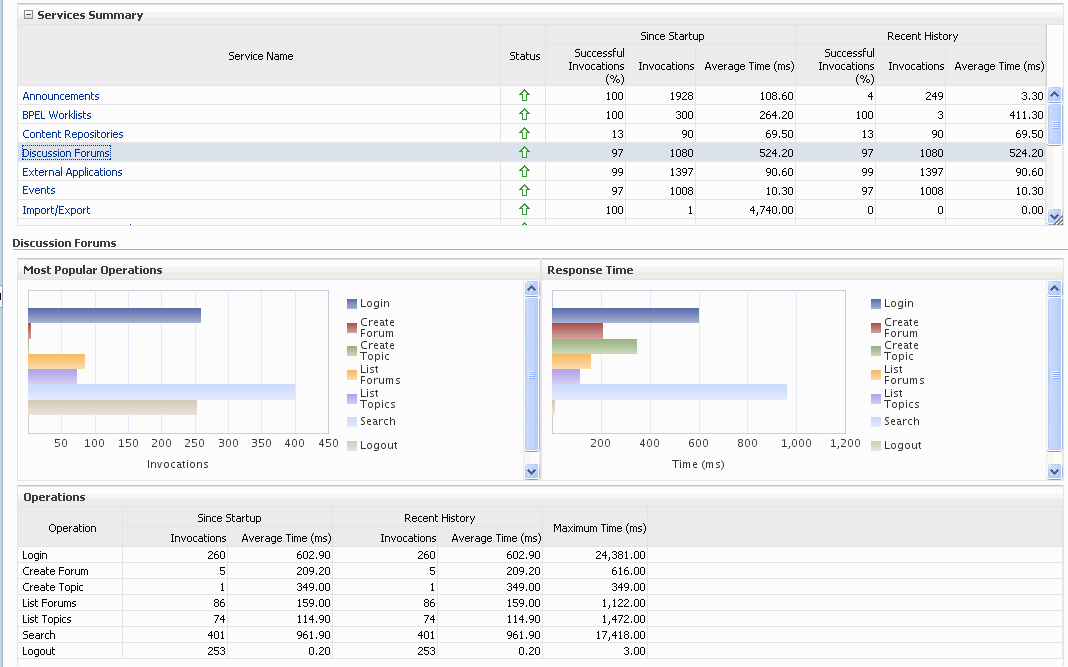
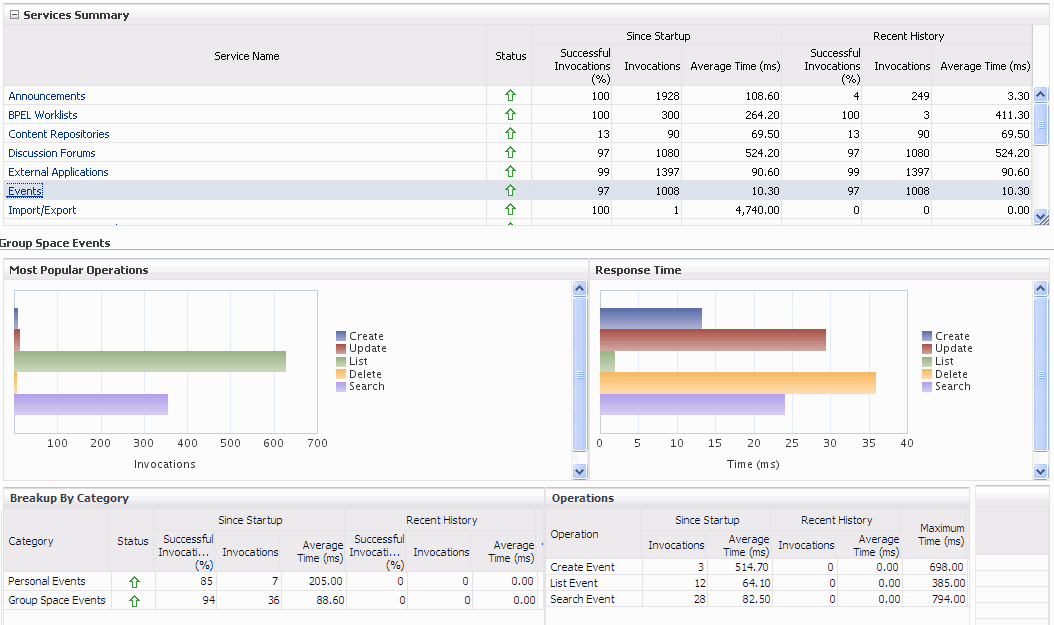
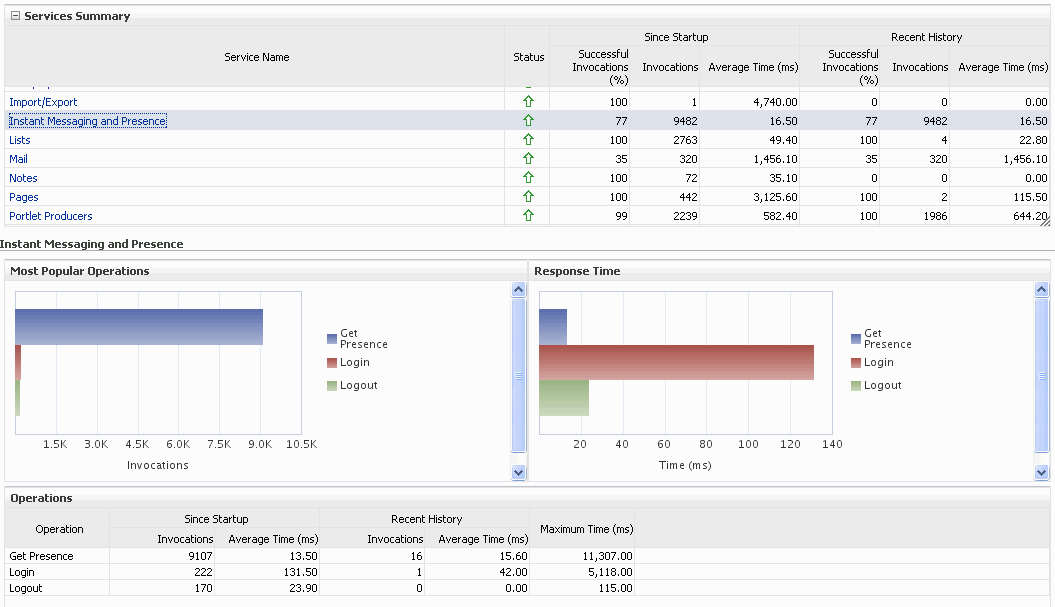
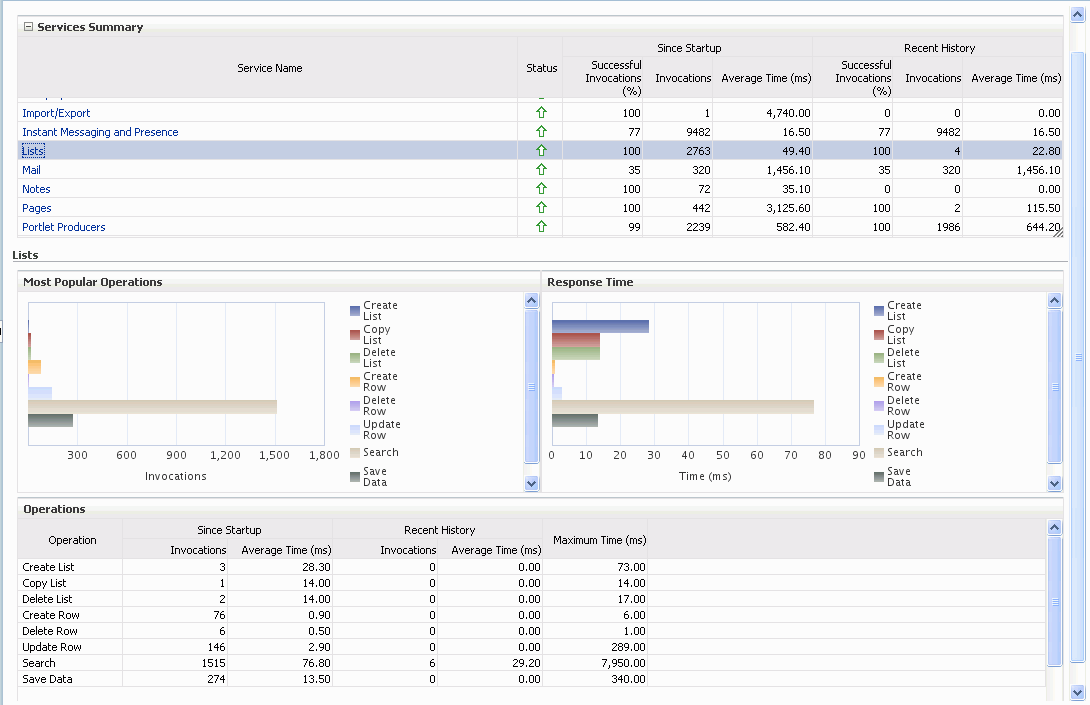
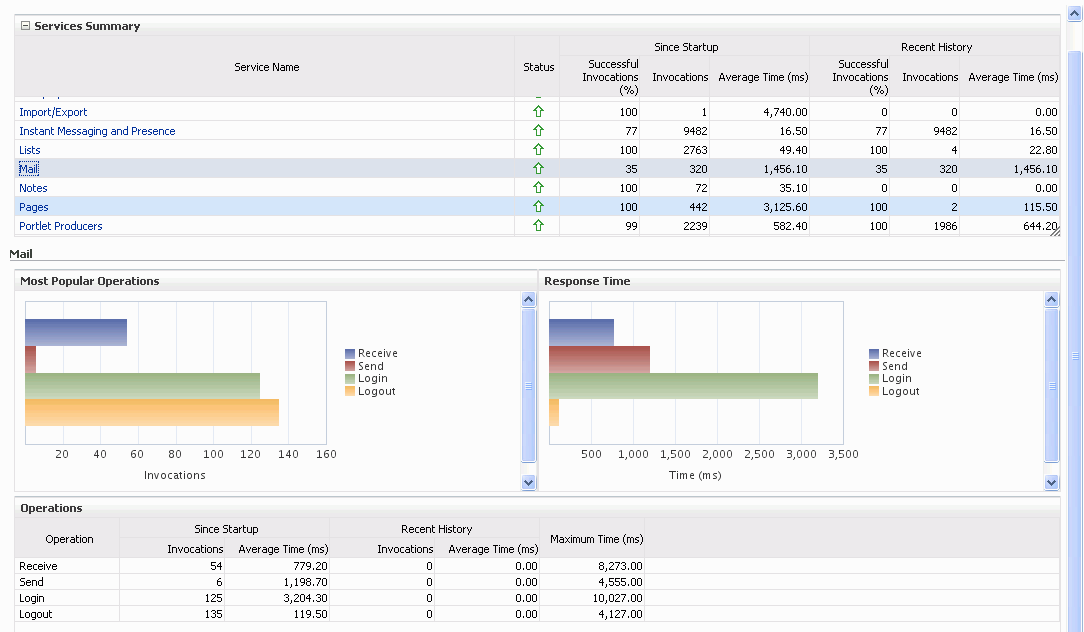
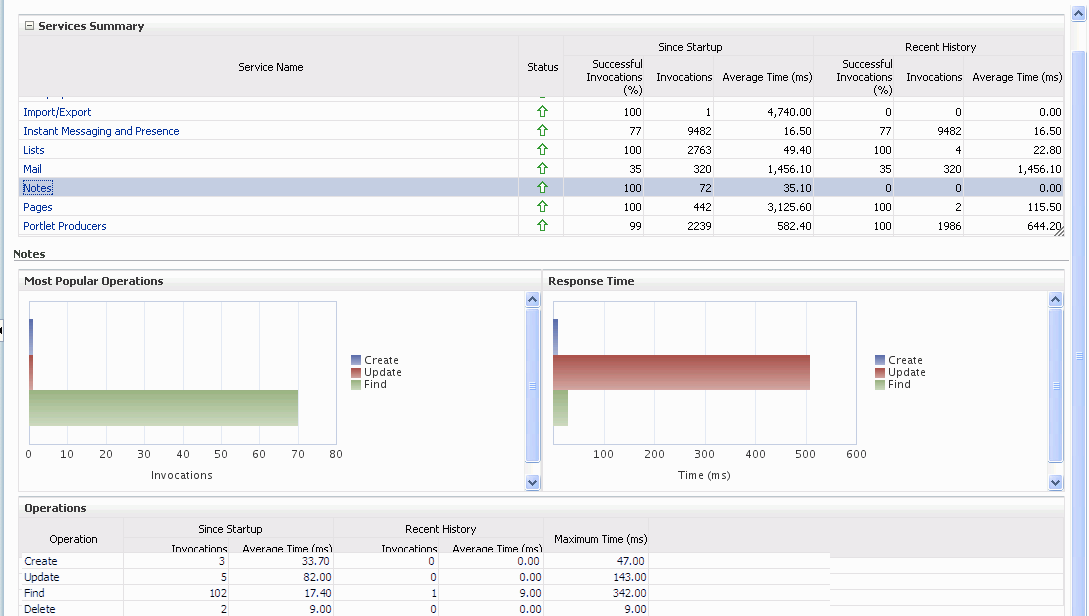
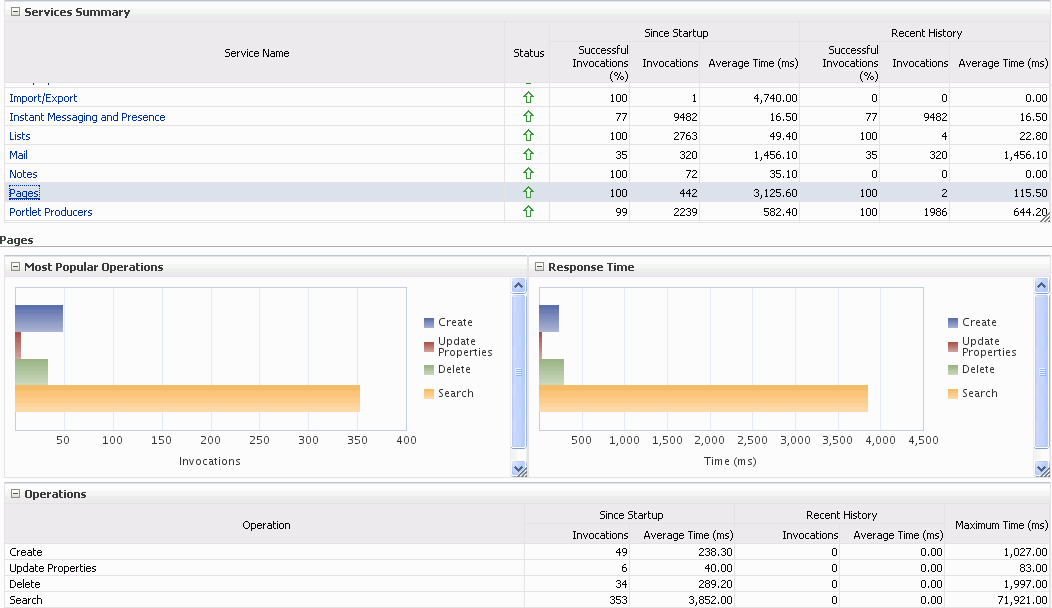
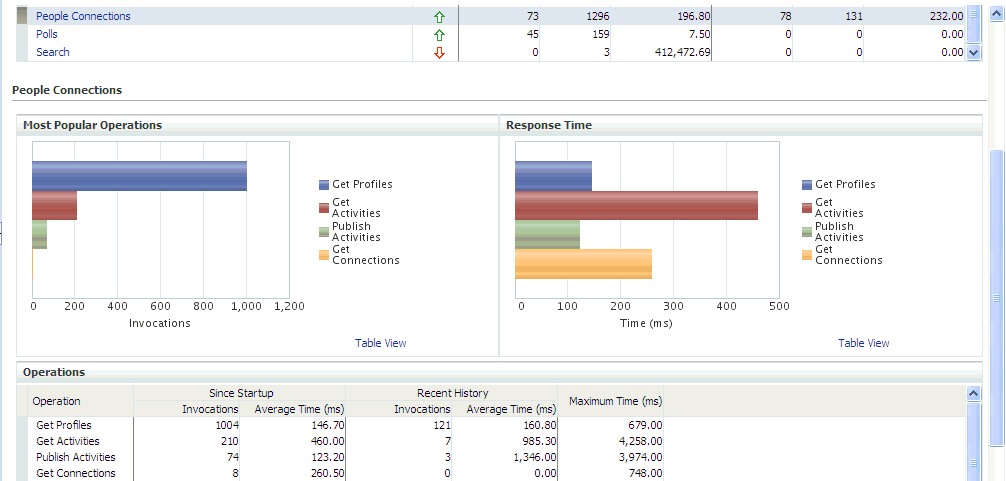
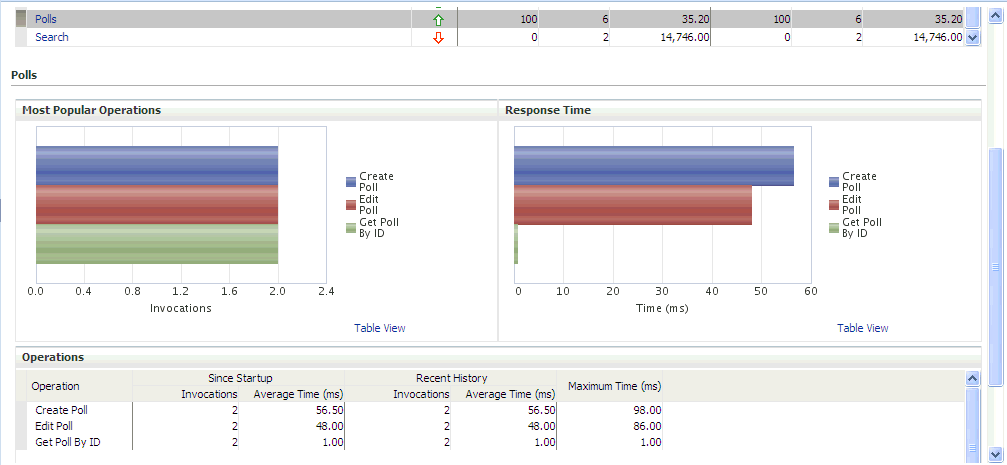
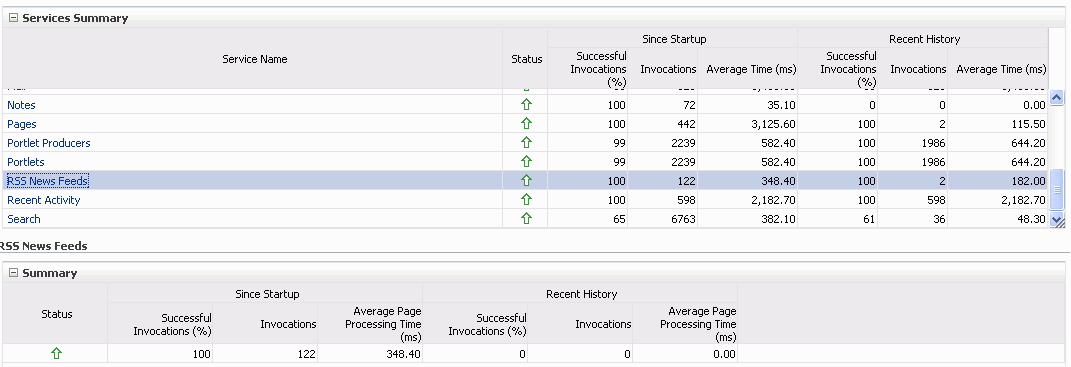
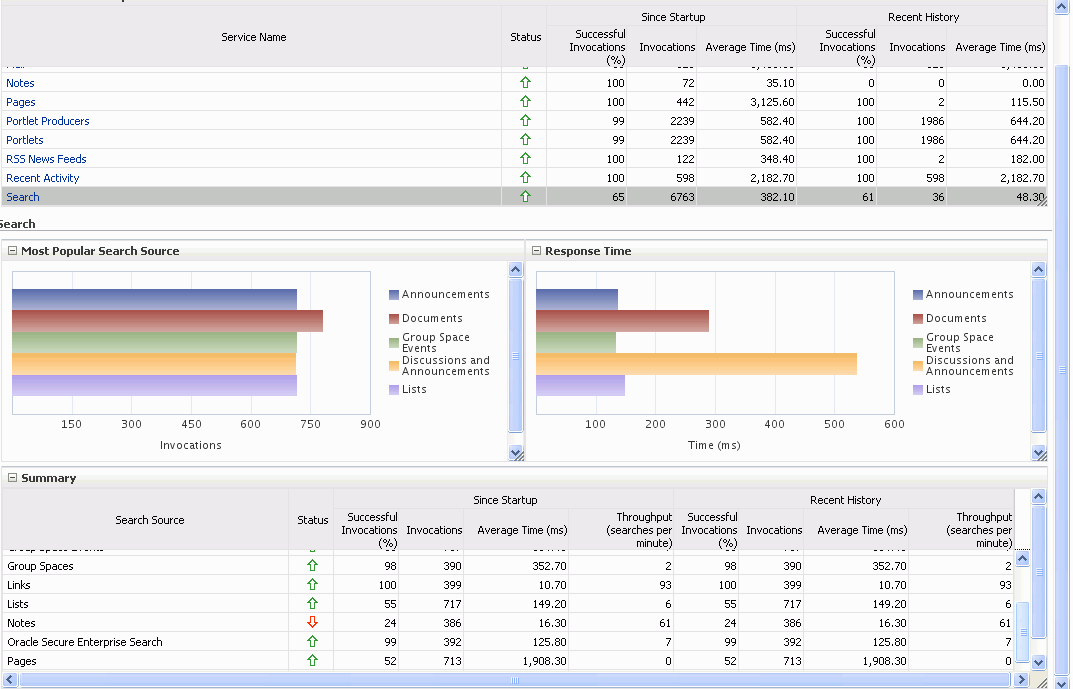
Services summary: Summary of performance metrics for each service used in a WebCenter Portal application. Table 39-16 lists services that use common performance metrics. Table 39-17 describes service metrics.
-
Most popular operations and response time for individual service operations. Table 39-18 describes these metrics.
-
Per operation metrics: Performance metrics for individual service operations. Table 39-16 lists common performance metrics used to monitor performance of individual operations. Table 39-18 describes these metrics.
Table 39-16 Common WebCenter Portal Service Metrics
| Service | Services Summary(Since Startup and Recent History) | Per Operation Metrics(Since Startup and Recent History) |
|---|---|---|
|
Announcements |
The performance metrics include:
|
The performance metrics include:
|
|
BPEL Worklist |
The performance metrics include:
|
Not applicable |
|
Discussion Forums |
The performance metrics include:
|
The performance metrics include:
|
|
External Applications |
The performance metrics include:
|
The performance metrics include:
|
|
Events |
The performance metrics include:
|
The performance metrics include:
|
|
Import/Export |
The performance metrics include:
|
The performance metrics include:
|
|
Instant Messaging and Presence (IMP) |
The performance metrics include:
|
The performance metrics include:
|
|
Lists |
The performance metrics include:
|
The performance metrics include:
|
|
|
The performance metrics include:
|
The performance metrics include:
|
|
Notes |
The performance metrics include:
|
The performance metrics include:
|
|
Pages |
The performance metrics include:
|
The performance metrics include:
|
|
People Connections |
The performance metrics include:
|
The performance metrics include:
|
|
Polls |
The performance metrics include:
|
The performance metrics include:
|
|
Recent Activity |
The performance metrics include:
|
Not available |
|
RSS |
The performance metrics include:
|
Not available |
|
Search |
The performance metrics include:
|
The performance metrics include:
|
Table 39-17 describes metrics used for monitoring performance of all operations.
Table 39-17 Description of Common Metrics - Summary (All Operations)
| Metric | Description |
|---|---|
|
Status |
The current status of the service:
If a particular service is "Down" or "Unknown", refer to Section 39.1.12.3, "WebCenter Portal Service-Specific Issues and Actions" for guidance on possible causes and actions. |
|
Successful Invocations (%) |
Percentage of a service invocations that succeeded. Successful Invocations (%) equals the number of successful invocations divided by the invocation count: - Since Startup - Recent History If Successful Invocations (%) is below 100%, check the diagnostic logs to establish why service requests are failing. See, Section 39.5, "Viewing and Configuring Log Information". |
|
Invocations |
This metric shows number of service invocations per minute: - Since Startup - Recent History This metric provides data on how frequently a particular service is being invoked for processing of operations. Comparing this metric across services can help determine the most frequently used WebCenter Portal services in the application. |
|
Average Time (ms) |
The average time taken to process operations associated with a service. This metric can be used with the Invocations metric to assess the total time spent in processing service operations. - Since Startup - Recent History Use this metric to determine the overall performance of WebCenter services. If this metric is out-of-bounds (the average time for operations is increasing or higher than expected), click individual service names to view more detailed metric data. |
Table 39-18 describes metrics used to monitor performance of each operation performed by a service or component.
Table 39-18 Description of Common Metrics - Per Operation
| Metric | Description |
|---|---|
|
Most Popular Operations |
The number of invocations per operation (displayed on a chart). The highest value on the chart indicates which operation is used the most. The lowest value indicates which operation is used the least. |
|
Response Time |
The average time to process operations associated with a service since the WebCenter Portal application started up (displayed on a chart). The highest value on the chart indicates the worst performing operation. The lowest value indicates which operation is performing the best. |
|
Operation |
The operation being monitored. See also Section 39.1.12.2, "WebCenter Portal Service-Specific Metrics". |
|
Invocations |
The number of invocations, per operation: - Since Startup - Recent History This metric provides data on how frequently a particular service is being invoked for processing of operations. Comparing this metric across services can help determine the most frequently used WebCenter Portal services in the application. |
|
Average Time (ms) |
The average time taken to process each operation: - Since Startup* - Recent History *This information is also displayed on the Response Time chart. |
|
Maximum Time (ms) |
The maximum time taken to process each operation. |
39.1.12.2 WebCenter Portal Service-Specific Metrics
This section describes per operation metrics for all services and components. This section includes the following sub sections:
To access live performance metrics for your WebCenter Portal application, see Section 39.2, "Viewing Performance Information Using Fusion Middleware Control."
39.1.12.2.1 Announcement Metrics
Performance metrics associated with the Announcements service (Figure 39-18) are described in Table 39-19 and Section 39.1.12.1, "Common WebCenter Portal Service Metrics."
To monitor these metrics through Fusion Middleware Control, see Section 39.2, "Viewing Performance Information Using Fusion Middleware Control."
Table 39-19 Announcements Service - Operations Monitored
| Operation | Description | Performance Issues - User Action |
|---|---|---|
|
Login |
Logs a WebCenter Portal user (accessing the Announcements service) into the discussions server that is hosting announcements. |
For service-specific causes, see Section 39.1.12.3.1, "Announcements Service - Issues and Actions." For common causes, see Section 39.1.4, "Understanding Some Common Performance Issues and Actions." |
|
Logout |
Logs a WebCenter Portal user out of the discussions server that is hosting announcements. |
For service-specific causes, see Section 39.1.12.3.1, "Announcements Service - Issues and Actions." For common causes, see Section 39.1.4, "Understanding Some Common Performance Issues and Actions." |
|
Search |
Searches for terms within announcement text. |
If Announcement searches are failing, verify that Announcement text contains the search terms. For other causes, see Section 39.1.12.3.1, "Announcements Service - Issues and Actions." For common causes, see Section 39.1.4, "Understanding Some Common Performance Issues and Actions." |
|
Create |
Creates an announcement. |
For service-specific causes, see Section 39.1.12.3.1, "Announcements Service - Issues and Actions.". For common causes, see Section 39.1.4, "Understanding Some Common Performance Issues and Actions." |
|
List |
Retrieves a list of announcements. |
For service-specific causes, see Section 39.1.12.3.1, "Announcements Service - Issues and Actions." For common causes, see Section 39.1.4, "Understanding Some Common Performance Issues and Actions." |
39.1.12.2.2 BPEL Worklist Metrics
Performance metrics associated with the BPEL Worklist service (Figure 39-19) are described in Section 39.1.12.1, "Common WebCenter Portal Service Metrics."
To monitor these metrics through Fusion Middleware Control, see Section 39.2, "Viewing Performance Information Using Fusion Middleware Control."
39.1.12.2.3 Content Repository Metrics
Performance metrics associated with the Documents service and Content Presenter (Figure 39-20 and Figure 39-21) are described in the following tables:
-
Table 39-21, "Content Repository Metrics - Summary (All Repositories)"
-
Table 39-22, "Content Repository Metrics - Operation Summary Per Repository"
-
Table 39-23, "Content Repository Metrics - Operation Detail Per Repository"
Figure 39-21 Content Repository Metrics - Per Operation
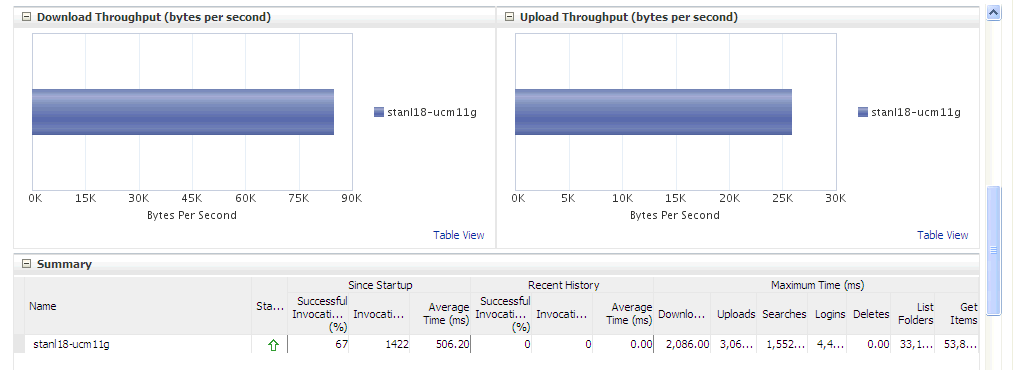
Description of "Figure 39-21 Content Repository Metrics - Per Operation"
To monitor these metrics through Fusion Middleware Control, see Section 39.2, "Viewing Performance Information Using Fusion Middleware Control."
Table 39-20 Content Repository - Operations Monitored
Table 39-21 Content Repository Metrics - Summary (All Repositories)
| Metric | Description |
|---|---|
|
Status |
The current status of the Documents service:
|
|
Successful Invocations (%) |
The percentage of Documents service invocations that succeeded (Upload, Download, Search Login, Delete): - Since Startup - Recent History If Successful Invocations (%) is below 100%, check the diagnostic logs to establish why service requests are failing. See, Section 39.5, "Viewing and Configuring Log Information." |
|
Invocations |
The number of Documents service invocations per minute (Upload, Download, Search Login, Delete): - Since Startup - Recent History This metric provides data on how frequently a particular service is being invoked for processing of operations. Comparing this metric across services can help determine the most frequently used WebCenter Portal service in the application. |
|
Average Time (ms) |
The average time taken to process operations associated with the Documents service (Upload, Download, Search Login, Delete): - Since Startup - Recent History |
|
Most Popular Operations |
The number of invocations per operation (displayed on a chart). The highest value on the chart indicates which operation is used the most. The lowest value indicates which operations is used the least. |
|
Response Time |
The average time to process operations associated with the Documents service since the WebCenter Portal application started up (displayed on a chart). The highest value on the chart indicates the worst performing operation. The lowest value indicates which operations is performing the best. |
|
Download Throughput (bytes per second) |
The rate at which the Documents service downloads documents. |
|
Upload Throughput (bytes per second) |
The rate at which the Documents service uploads documents |
Table 39-22 Content Repository Metrics - Operation Summary Per Repository
| Metric | Description |
|---|---|
|
Status |
The current status of the content repository:
|
|
Successful Invocations (%) |
The percentage of Documents service invocations that succeeded (Upload, Download, Search, Login, Delete) for this content repository: - Since Startup - Recent History If Successful Invocations (%) is below 100%, check the diagnostic logs to establish why service requests are failing. See, Section 39.5, "Viewing and Configuring Log Information". |
|
Invocations |
The number of Documents service invocations per minute (Upload, Download, Search, Login, Delete) for this content repository: - Since Startup - Recent History This metric provides data on how frequently a particular service is being invoked for processing of operations. Comparing this metric across services can help determine the most frequently used WebCenter Portal service in the application. |
|
Average Time (ms) |
The average time taken to process operations associated with the Documents service (Upload, Download, Search, Login, Delete) for this content repository: - Since Startup - Recent History |
|
Bytes Downloaded |
The volume of data that the Documents service has downloaded from this content repository. |
|
Download Throughput (bytes per second) |
The rate at which the Documents service downloads documents from this content repository. |
|
Bytes Uploaded |
The volume of data that the Documents service has uploaded from this content repository. |
|
Upload Throughput (bytes per second) |
The rate at which the Documents service uploads documents from this content repository. |
|
Maximum Time (ms) |
The maximum time to process operations associated with the Documents service (Upload, Download, Search, Login, Delete) for this content repository. |
Table 39-23 Content Repository Metrics - Operation Detail Per Repository
| Metric | Description |
|---|---|
|
Invocations |
The number of Documents service invocations per operation (Upload, Download, Search, Login, Delete): - Since Startup - Recent History This metric provides data on how frequently a particular service is being invoked for processing of operations. Comparing this metric across services can help determine the most frequently used WebCenter Portal service in the application. |
|
Average Processing Time (ms) |
The average time taken to process each operation associated with the Documents service (Upload, Download, Search, Login, Delete): - Since Startup - Recent History |
39.1.12.2.4 Discussion Metrics
Performance metrics associated with the Discussions service (Figure 39-22) are described in Table 39-24 and Section 39.1.12.1, "Common WebCenter Portal Service Metrics."
To monitor these metrics through Fusion Middleware Control, see Section 39.2, "Viewing Performance Information Using Fusion Middleware Control."
Table 39-24 Discussions Service - Operations Monitored
| Operation | Description | Performance Issues - User Action |
|---|---|---|
|
Login |
Logs a WebCenter Portal user (accessing the Discussions service) into the discussions server that is hosting discussions forums. |
For service-specific causes, see Section 39.1.12.3.4, "Discussions Service - Issues and Actions." For common causes, see Section 39.1.4, "Understanding Some Common Performance Issues and Actions." |
|
Logout |
Logs a WebCenter Portal user out of the discussions server that is hosting discussion forums. |
For service-specific causes, see Section 39.1.12.3.4, "Discussions Service - Issues and Actions." For common causes, see Section 39.1.4, "Understanding Some Common Performance Issues and Actions." |
|
Create Forum |
Creates a discussion forum in the discussions server, under a specific category. |
If you are having problems creating forums, it may be due to:
For other service-specific causes, see Section 39.1.12.3.4, "Discussions Service - Issues and Actions." For common causes, see Section 39.1.4, "Understanding Some Common Performance Issues and Actions." |
|
Create Topic |
Creates a topic in the discussions server, under a specific forum. |
If you are having problems creating topics, it may be due to:
For other service-specific causes, see Section 39.1.12.3.4, "Discussions Service - Issues and Actions". For information on common causes, see Section 39.1.4, "Understanding Some Common Performance Issues and Actions". |
|
List Forums |
Retrieves a list of forums, under a specific category, from the discussion server. |
If you are having problems viewing discussion forums, it may be due to:
For other service-specific causes, see Section 39.1.12.3.4, "Discussions Service - Issues and Actions." For common causes, see Section 39.1.4, "Understanding Some Common Performance Issues and Actions." |
|
List Topics |
Retrieves a list of topics, under a specific forum, from the discussion server. |
If you are having problems viewing topics, it may be due to:
For other service-specific causes, see Section 39.1.12.3.4, "Discussions Service - Issues and Actions." For common causes, see Section 39.1.4, "Understanding Some Common Performance Issues and Actions." |
|
Search |
Searches for terms within discussion forum text, in the discussions server. |
If you are having problems searching forums, it may be due to:
For other service-specific causes, see Section 39.1.12.3.4, "Discussions Service - Issues and Actions." For common causes, see Section 39.1.4, "Understanding Some Common Performance Issues and Actions." |
39.1.12.2.5 Events Metrics
Performance metrics associated with the Events service are described in Table 39-25 and Section 39.1.12.1, "Common WebCenter Portal Service Metrics."
To monitor these metrics through Fusion Middleware Control, see Section 39.2, "Viewing Performance Information Using Fusion Middleware Control."
Table 39-25 Events Service - Operations Monitored
| Operation | Description | Performance Issues - User Action |
|---|---|---|
|
Create Event |
Creates a space or personal event in the WebCenter Portal's repository. |
For service-specific causes, see Section 39.1.12.3.6, "Events Service - Issues and Actions." For common causes, see Section 39.1.4, "Understanding Some Common Performance Issues and Actions." |
|
Update Event |
Updates a space or personal event stored in the WebCenter Portal's repository. |
For service-specific causes, see Section 39.1.12.3.6, "Events Service - Issues and Actions." For common causes, see Section 39.1.4, "Understanding Some Common Performance Issues and Actions." |
|
Delete Event |
Deletes a space or personal event in the WebCenter Portal's repository. |
For service-specific causes, see Section 39.1.12.3.6, "Events Service - Issues and Actions." For common causes, see Section 39.1.4, "Understanding Some Common Performance Issues and Actions." |
|
List Event |
Retrieves a list of events from the WebCenter Portal's repository. |
For service-specific causes, see Section 39.1.12.3.6, "Events Service - Issues and Actions." For common causes, see Section 39.1.4, "Understanding Some Common Performance Issues and Actions." |
|
Search Event |
Searches for terms within event text. |
For service-specific causes, see Section 39.1.12.3.6, "Events Service - Issues and Actions." For common causes, see Section 39.1.4, "Understanding Some Common Performance Issues and Actions." |
39.1.12.2.6 External Application Metrics
Performance metrics associated with the External Application service are described in Table 39-26 and Section 39.1.12.1, "Common WebCenter Portal Service Metrics."
Figure 39-24 External Application Metrics
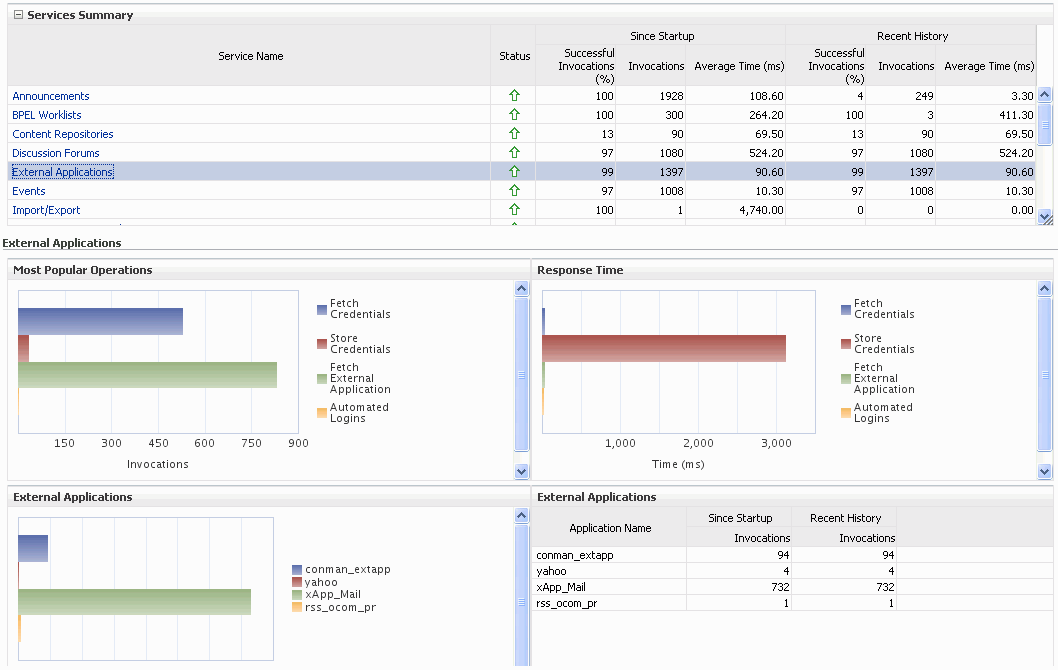
Description of "Figure 39-24 External Application Metrics"
Figure 39-25 External Application Metrics - Per Operation
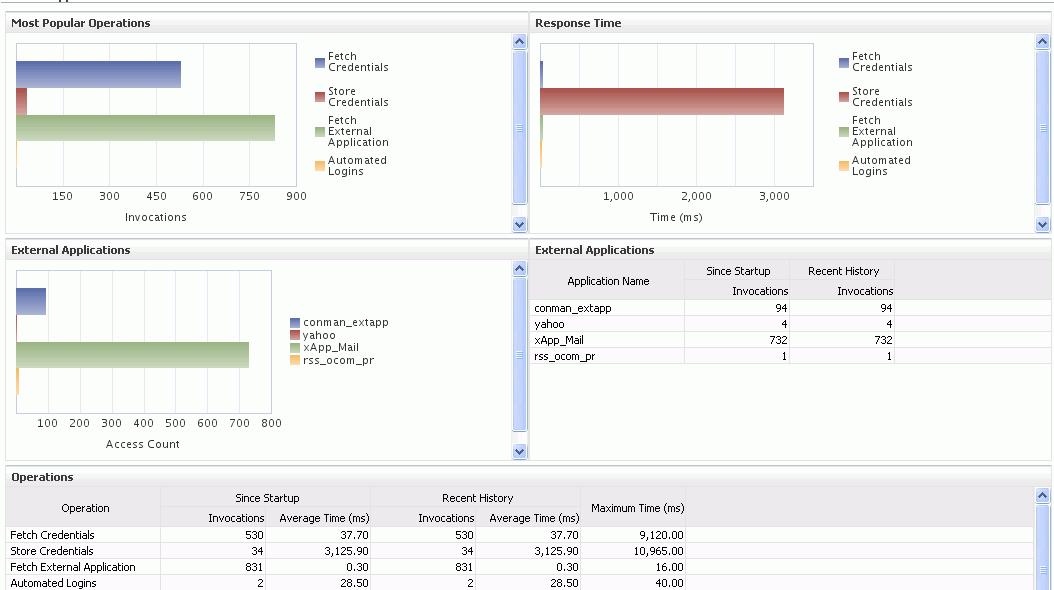
Description of "Figure 39-25 External Application Metrics - Per Operation"
To monitor these metrics through Fusion Middleware Control, see Section 39.2, "Viewing Performance Information Using Fusion Middleware Control."
Table 39-26 External Applications - Operations Monitored
| Operation | Description | Performance Issues - User Action |
|---|---|---|
|
Fetch Credentials |
Retrieves credentials for an external application. |
For service-specific causes, see Section 39.1.12.3.5, "External Applications Service - Issues and Actions." For common causes, see Section 39.1.4, "Understanding Some Common Performance Issues and Actions." |
|
Store Credentials |
Stores user credentials for an external application. |
For service-specific causes, see Section 39.1.12.3.5, "External Applications Service - Issues and Actions." For common causes, see Section 39.1.4, "Understanding Some Common Performance Issues and Actions." |
|
Fetch External Application |
Retrieves an external application. |
For service-specific causes, see Section 39.1.12.3.5, "External Applications Service - Issues and Actions." For common causes, see Section 39.1.4, "Understanding Some Common Performance Issues and Actions." |
|
Automated Logins |
Logs a WebCenter Portal user in to an external application (using the automated login feature). |
For service-specific causes, see Section 39.1.12.3.5, "External Applications Service - Issues and Actions." For common causes, see Section 39.1.4, "Understanding Some Common Performance Issues and Actions." |
39.1.12.2.7 Instant Messaging and Presence (IMP) Metrics
Performance metrics associated with the Instant Messaging and Presence (IMP) service (Figure 39-26) are described in Table 39-27 and Section 39.1.12.1, "Common WebCenter Portal Service Metrics."
To monitor these metrics through Fusion Middleware Control, see Section 39.2, "Viewing Performance Information Using Fusion Middleware Control."
Table 39-27 Instant Messaging and Presence Service - Operations Monitored
| Operation | Description | Performance Issues - User Action |
|---|---|---|
|
Get Presence |
Retrieves user presence information from the IMP server. |
For service-specific causes, see Section 39.1.12.3.7, "Instant Messaging and Presence (IMP) Service - Issues and Actions." For common causes, see Section 39.1.4, "Understanding Some Common Performance Issues and Actions." |
|
Login |
Logs a WebCenter Portal user (accessing the IMP service) into the IMP server. |
For service-specific causes, see Section 39.1.12.3.7, "Instant Messaging and Presence (IMP) Service - Issues and Actions." For common causes, see Section 39.1.4, "Understanding Some Common Performance Issues and Actions." |
|
Logout |
Logs a WebCenter Portal user (accessing the IMP service) out of the IMP server. |
For service-specific causes, see Section 39.1.12.3.7, "Instant Messaging and Presence (IMP) Service - Issues and Actions." For common causes, see Section 39.1.4, "Understanding Some Common Performance Issues and Actions." |
39.1.12.2.8 Import and Export Metrics
Performance metrics associated with import and export services (Figure 39-27) are described in Table 39-28 and Section 39.1.12.1, "Common WebCenter Portal Service Metrics." These metrics apply to Spaces only.
To monitor these metrics through Fusion Middleware Control, see Section 39.2, "Viewing Performance Information Using Fusion Middleware Control."
Table 39-28 Import/Export - Operations Monitored
| Operation | Description | Performance Issues - User Action |
|---|---|---|
|
Export |
Exports an entire WebCenter Portal application. |
For service-specific causes, see Section 39.1.12.3.8, "Import and Export - Issues and Actions." For common causes, see Section 39.1.4, "Understanding Some Common Performance Issues and Actions." |
|
Import |
Imports entire WebCenter Portal application. |
For service-specific causes, see Section 39.1.12.3.8, "Import and Export - Issues and Actions." For common causes, see Section 39.1.4, "Understanding Some Common Performance Issues and Actions." |
39.1.12.2.9 List Metrics
(WebCenter Portal: Spaces only) Performance metrics associated with the List service (Figure 39-28) are described in Table 39-29 and Section 39.1.12.1, "Common WebCenter Portal Service Metrics."
To monitor these metrics through Fusion Middleware Control, see Section 39.2, "Viewing Performance Information Using Fusion Middleware Control."
Table 39-29 List service - Operations Monitored
| Operation | Description | Performance Issues - User Action |
|---|---|---|
|
Create List |
Creates a list in the user session. The Save Data operation commits new lists to the MDS repository. |
For service-specific causes, see Section 39.1.12.3.9, "Lists Service - Issues and Actions." For common causes, see Section 39.1.4, "Understanding Some Common Performance Issues and Actions." |
|
Copy List |
Copies a list and its data in the user session. The Save Data operation commits copied lists and list data to the MDS repository and the WebCenter Portal's repository (the database where list data is stored). |
For service-specific causes, see Section 39.1.12.3.9, "Lists Service - Issues and Actions." For common causes, see Section 39.1.4, "Understanding Some Common Performance Issues and Actions." |
|
Delete List |
Deletes a list and its data in the user session. The Save Data operation commits list changes to the MDS repository and the WebCenter Portal's repository (the database where list data is stored). |
For service-specific causes, see Section 39.1.12.3.9, "Lists Service - Issues and Actions." For common causes, see Section 39.1.4, "Understanding Some Common Performance Issues and Actions." |
|
Create Row |
Creates row of list data in the user session. The Save Data operation commits list data changes to the WebCenter Portal's repository (the database where list data is stored). |
For service-specific causes, see Section 39.1.12.3.9, "Lists Service - Issues and Actions." For common causes, see Section 39.1.4, "Understanding Some Common Performance Issues and Actions." |
|
Update Row |
Updates row of list data in the user session. The Save Data operation commits list data changes to the WebCenter Portal's repository (the database where list data is stored). |
For service-specific causes, see Section 39.1.12.3.9, "Lists Service - Issues and Actions." For common causes, see Section 39.1.4, "Understanding Some Common Performance Issues and Actions." |
|
Delete Row |
Deletes row of list data in the user session. The Save Data operation commits list data changes to the WebCenter Portal's repository (the database where list data is stored). |
For service-specific causes, see Section 39.1.12.3.9, "Lists Service - Issues and Actions." For common causes, see Section 39.1.4, "Understanding Some Common Performance Issues and Actions." |
|
Search |
Retrieves a list by its ID from the Metadata repository. |
For service-specific causes, see Section 39.1.12.3.9, "Lists Service - Issues and Actions." For common causes, see Section 39.1.4, "Understanding Some Common Performance Issues and Actions." |
|
Save Data |
Saves all changes to lists and list data (in the user session) to the Metadata Services repository and the WebCenter Portal's repository (the database where list information is stored). |
For service-specific causes, see Section 39.1.12.3.9, "Lists Service - Issues and Actions." For common causes, see Section 39.1.4, "Understanding Some Common Performance Issues and Actions." |
39.1.12.2.10 Mail Metrics
Performance metrics associated with the Mail service (Figure 39-29) are described in Table 39-30 and Section 39.1.12.1, "Common WebCenter Portal Service Metrics."
To monitor these metrics through Fusion Middleware Control, see Section 39.2, "Viewing Performance Information Using Fusion Middleware Control."
Table 39-30 Mail Service - Operations Monitored
39.1.12.2.11 Note Metrics
Performance metrics associated with the Notes service (Figure 39-30) are described in Table 39-31 and Section 39.1.12.1, "Common WebCenter Portal Service Metrics."
To monitor these metrics through Fusion Middleware Control, see Section 39.2, "Viewing Performance Information Using Fusion Middleware Control."
Table 39-31 Notes Service - Operations Monitored
| Operation | Description | Performance Issues - User Action |
|---|---|---|
|
Create |
Creates a personal note. The Save Changes operation commits new notes to the MDS repository. |
For service-specific causes, see Section 39.1.12.3.11, "Notes Service - Issues and Actions." For common causes, see Section 39.1.4, "Understanding Some Common Performance Issues and Actions." |
|
Update |
Updates a personal note. The Save Changes operation commits note updates to the MDS repository. |
For service-specific causes, see Section 39.1.12.3.11, "Notes Service - Issues and Actions." For common causes, see Section 39.1.4, "Understanding Some Common Performance Issues and Actions." |
|
Find |
Retrieves a note from the MDS repository. |
For service-specific causes, see Section 39.1.12.3.11, "Notes Service - Issues and Actions." For common causes, see Section 39.1.4, "Understanding Some Common Performance Issues and Actions." |
|
Delete |
Deletes a note from the MDS repository. |
For service-specific causes, see Section 39.1.12.3.11, "Notes Service - Issues and Actions." For common causes, see Section 39.1.4, "Understanding Some Common Performance Issues and Actions." |
39.1.12.2.12 Page Operation Metrics
Performance metrics associated with the Page service (Figure 39-31) are described in Table 39-32 and Section 39.1.12.1, "Common WebCenter Portal Service Metrics."
Note:
The Page service metrics discussed in this section are different from the page request metrics discussed in Section 39.1.5, "Understanding Page Request Metrics." Page service metrics monitor page related operations such as creating pages. Whereas the page request metrics monitor individual page view/display requests (do not include page edit operations).
To monitor these metrics through Fusion Middleware Control, see Section 39.2, "Viewing Performance Information Using Fusion Middleware Control."
Table 39-32 Page Service - Operations Monitored
| Operation | Description | Performance Issues - User Action |
|---|---|---|
|
Create |
Creates a page in the WebCenter Portal application. |
For service-specific causes, see Section 39.1.12.3.12, "Page Service - Issues and Actions." For common causes, see Section 39.1.4, "Understanding Some Common Performance Issues and Actions." |
|
Copy |
Copies a page. |
For service-specific causes, see Section 39.1.12.3.12, "Page Service - Issues and Actions." For common causes, see Section 39.1.4, "Understanding Some Common Performance Issues and Actions." |
|
Delete |
Deletes a page. |
For service-specific causes, see Section 39.1.12.3.12, "Page Service - Issues and Actions." For common causes, see Section 39.1.4, "Understanding Some Common Performance Issues and Actions." |
|
Search |
Searches for pages that contain a specific term. |
For service-specific causes, see Section 39.1.12.3.12, "Page Service - Issues and Actions." For common causes, see Section 39.1.4, "Understanding Some Common Performance Issues and Actions." |
39.1.12.2.13 People Connection Metrics
Performance metrics associated with the People Connections service are described in Table 39-33 and Section 39.1.12.1, "Common WebCenter Portal Service Metrics."
To monitor these metrics through Fusion Middleware Control, see Section 39.2, "Viewing Performance Information Using Fusion Middleware Control."
Table 39-33 People Connections Service - Operations Monitored
39.1.12.2.14 Poll Metrics
Performance metrics associated with the Polls service (Figure 39-33) are described in Table 39-34 and Section 39.1.12.1, "Common WebCenter Portal Service Metrics."
To monitor these metrics through Fusion Middleware Control, see Section 39.2, "Viewing Performance Information Using Fusion Middleware Control."
Table 39-34 Polls Service - Operations Monitored
39.1.12.2.15 RSS News Feed Metrics
Performance metrics associated with the RSS service (Figure 39-34) are described in Section 39.1.12.1, "Common WebCenter Portal Service Metrics."
To monitor these metrics through Fusion Middleware Control, see Section 39.2, "Viewing Performance Information Using Fusion Middleware Control."
39.1.12.2.16 Recent Activity Metrics
Performance metrics associated with the Recent Activities service (Figure 39-35) are described in Section 39.1.12.1, "Common WebCenter Portal Service Metrics."
To monitor these metrics through Fusion Middleware Control, see Section 39.2, "Viewing Performance Information Using Fusion Middleware Control."
39.1.12.2.17 Search Metrics
Performance metrics associated with the Search service (Figure 39-36) are described in Table 39-35 and Section 39.1.12.1, "Common WebCenter Portal Service Metrics."
To monitor these metrics through Fusion Middleware Control, see Section 39.2, "Viewing Performance Information Using Fusion Middleware Control."
Table 39-35 Search Service - Search Sources
| Operation | Description |
|---|---|
|
Announcements |
Announcement text is searched. |
|
Documents |
Contents in files and folders are searched. |
|
Discussion Forums |
Forums and topics are searched. |
|
Spaces |
Contents saved in a space, such as links, lists, notes, tags, and events are searched. |
|
Space Events |
Space events are searched. |
|
Links |
Objects to which links have been created are searched (for example, announcements, discussion forum topics, documents, and events). |
|
Lists |
Information stored in lists is searched. |
|
Notes |
Notes text, such as reminders, is searched. |
|
Oracle Secure Enterprise Search |
Contents from the Document Library task flow, discussions, tag clouds, notes, and other WebCenter Portal services are searched. |
|
Pages |
Contents added to application, personal, public, wiki, and blog pages are searched. |
39.1.12.3 WebCenter Portal Service-Specific Issues and Actions
This section describes service-specific issues and user actions required to address those issue. This section includes the following sub sections:
Note:
For information about tuning the performance of WebCenter Portal services, see Appendix A, "WebCenter Portal Configuration."
-
Section 39.1.12.3.1, "Announcements Service - Issues and Actions"
-
Section 39.1.12.3.2, "BPEL Worklist Service - Issues and Actions"
-
Section 39.1.12.3.4, "Discussions Service - Issues and Actions"
-
Section 39.1.12.3.5, "External Applications Service - Issues and Actions"
-
Section 39.1.12.3.7, "Instant Messaging and Presence (IMP) Service - Issues and Actions"
-
Section 39.1.12.3.8, "Import and Export - Issues and Actions"
-
Section 39.1.12.3.13, "Portlets and Producers - Issues and Actions"
-
Section 39.1.12.3.14, "People Connections Service - Issues and Actions"
-
Section 39.1.12.3.17, "Recent Activities Service - Issues and Actions"
39.1.12.3.1 Announcements Service - Issues and Actions
If you are experiencing problems with the Announcements service and the status is Down, check the diagnostic logs to establish why this service is unavailable. Some typical causes of failure include:
-
Discussions server is down or not responding.
-
Network connectivity issues exist between the application and the Discussions server.
-
Connection configuration information associated with the Announcements service is incorrect or no longer valid.
39.1.12.3.2 BPEL Worklist Service - Issues and Actions
If you are experiencing problems with the BPEL Worklist service and the status is Down, check the diagnostic logs to establish why this service is unavailable. Some typical causes of failure include:
-
BPEL server being queried is not available.
-
Network connectivity issues exist between the application and the BPEL server.
-
Connection configuration information associated with the Worklist service is incorrect or no longer valid.
39.1.12.3.3 Content Repository (Documents and Content Presenter) Service - Issues and Actions
If you are experiencing problems with the Documents service and the status is Down, check the diagnostic logs to establish why this service is unavailable. Also, do one of the following:
-
For Oracle WebCenter Content: Content Server (Content Server) and Oracle Portal, verify that the back-end server is up and running.
-
For Content Server, verify that the socket connection is open for the client for which the service is not functioning properly. Check the list of IP addresses that are allowed to communicate with the Content Server through the Intradoc Server Port (IP Address Filter). For details, see "Using Fusion Middleware Control to Modify the Server Configuration" in Oracle Fusion Middleware Administering Oracle WebCenter Content.
-
For Oracle Portal, verify the status of the JDBC connection using Oracle WebLogic Administration Console.
-
(Functional check) Check logs on the back-end server. For Content Server, go to Content Server > Administration > Log files > Content Server Logs. For Oracle Portal use Fusion Middleware Control.
-
(Functional check) Search for entries in the diagnostic log where the module name starts with
oracle.vcr,oracle.webcenter.content,oracle.webcenter.doclib, andoracle.stellent. Specifically, the diagnostics log for the managed server on which the WebCenter Portal application is deployed located at:DOMAIN_HOME/servers/managed_server_name/logs/<managed_server>-diagnostic.logsFor example, the diagnostics log for the Spaces application is named
WC_Spaces-diagnostic.log.See also Section 39.5, "Viewing and Configuring Log Information".
39.1.12.3.4 Discussions Service - Issues and Actions
If you are experiencing problems with the Discussions service and the status is Down, check the diagnostic logs to establish why this service is unavailable. Some typical causes of failure include:
-
Discussions server is down or not responding.
-
Network connectivity issues exist between the application and the discussion server.
-
Connection configuration information associated with the Discussions service is incorrect or no longer valid.
39.1.12.3.5 External Applications Service - Issues and Actions
If you are experiencing problems with the External Applications service and the status is Down, check the diagnostic logs to establish why this service is unavailable. Some typical causes of failure include:
-
Credential store is not configured for the application.
-
Credential store that is configured, for example Oracle Internet Directory, is down or not responding.
39.1.12.3.6 Events Service - Issues and Actions
If you are experiencing problems with the Events (space events or personal events) service and the status is Down, check the diagnostic logs to establish why this service is unavailable. Some typical causes of failure include:
-
WebCenter Portal's repository is not available (the database where event information is stored).
-
Network connectivity issues exist between the application and the WebCenter Portal's repository.
-
Connection configuration information associated with the Events service is incorrect or no longer valid.
39.1.12.3.7 Instant Messaging and Presence (IMP) Service - Issues and Actions
If you are experiencing problems with the IMP service and the status is Down, check the diagnostic logs to establish why this service is unavailable. Some typical causes of failure include:
-
Instant Messaging and Presence server is not available.
-
Network connectivity issues exist between the application and the Instant Messaging and Presence server.
-
Connection configuration information associated with the IMP service is incorrect or no longer valid.
39.1.12.3.8 Import and Export - Issues and Actions
If you are experiencing import and export problems and the status is Down, check the diagnostic logs to establish why this service is unavailable.
39.1.12.3.9 Lists Service - Issues and Actions
If you are experiencing problems with the Lists service and the status is Down, check the diagnostic logs to establish why this service is unavailable. Some typical causes of failure include:
-
MDS repository or WebCenter Portal's repository, in which the data of the Lists service is stored, is not available.
-
Network connectivity issues exist between the application and the repository.
39.1.12.3.10 Mail Service - Issues and Actions
If you are experiencing problems with the Mail service and the status is Down, check the diagnostic logs to establish why this service is unavailable. Some typical causes of failure include:
-
Mail server is not available.
-
Network connectivity issues exist between the application and the mail server.
-
Connection configuration information associated with the Mail service is incorrect or no longer valid.
39.1.12.3.11 Notes Service - Issues and Actions
If you are experiencing problems with the Notes service, check if the MDS repository is unavailable or responding slowly (the repository where note information is stored).
39.1.12.3.12 Page Service - Issues and Actions
If you are experiencing problems with the Page service and the status is Down, check the diagnostic logs to establish why this service is unavailable. Some typical causes of failure include:
-
WebCenter Portal's repository is not available (the database where page information is stored).
-
Network connectivity issues exist between the application and the WebCenter Portal's repository.
39.1.12.3.13 Portlets and Producers - Issues and Actions
If you are experiencing problems with a portlet producer and the status is Down, check the diagnostic logs to establish why this service is unavailable. Some typical causes of failure include:
-
Portlet producer server is down or not responding.
-
Connection configuration information associated with the portlet producer is incorrect or no longer valid.
-
Producer requests are timing out.
-
There may be a problem with a particular producer, or the performance issue is due to a specific portlet(s) from that producer.
39.1.12.3.14 People Connections Service - Issues and Actions
If you are experiencing problems with the People Connections service and the status is Down, check the diagnostic logs to establish why this service is unavailable. Some typical causes of failure include:
-
The service is down or not responding.
-
WebCenter Portal's repository is not available (the database where people connection information is stored).
-
Network connectivity issues exist between the application and the WebCenter Portal's repository.
39.1.12.3.15 Polls Service - Issues and Actions
If you are experiencing problems with the Polls service and the status is Down, check the diagnostic logs to establish why this service is unavailable. Some typical causes of failure include:
-
The service is down or not responding.
-
WebCenter Portal's repository is not available (the database where polls information is stored).
-
Network connectivity issues exist between the application and the WebCenter Portal's repository.
39.1.12.3.16 RSS Service - Issues and Actions
If you are experiencing problems with the RSS service and the status is Down, check the diagnostic logs to establish why this service is unavailable. Some typical causes of failure include:
-
The RSS service is not available.
-
A service being searched for activity data has failed, for example:
-
Unable to get discussions or announcement data - check the performance of the Discussions and Announcement services.
-
Unable to get list data - check the performance of the Lists service.
-
Unable to get recent activities data - check the performance of the Recent Activity service.
-
39.1.12.3.17 Recent Activities Service - Issues and Actions
If you are facing problems with the Recent Activities service and the status is Down, check the diagnostic logs to establish why this service is unavailable. Some typical causes of failure include:
-
Recent Activities service is not available.
-
A service being searched for recent activity has failed.
39.1.12.3.18 Search Service - Issues and Actions
If you are facing problems with the Search service (a service executor) and the status is Down, check the diagnostic logs to establish why this executor is unavailable. Some typical causes of failure include:
-
The repository of the executor is not available.
-
Network connectivity issues exist between the application and the repository of the executor.
-
Connection configuration information associated with the executor is incorrect or no longer valid.
-
Content repositories being searched is currently unavailable.
39.2 Viewing Performance Information Using Fusion Middleware Control
Fusion Middleware Control monitors a wide range of performance metrics for WebCenter Portal applications.
This section includes the following subsections:
39.2.1 Monitoring a Spaces Application
Administrators can monitor the performance and availability of all the components and services that make up a Spaces application, and the application as a whole. These detailed metrics will help diagnose performance issues and, if monitored regularly, you will learn to recognize trends as they develop and prevent performance problems in the future.
Some key performance metrics display on the Spaces home page (Figure 39-37).
The charts at the top of the page enable you to see at a glance whether the Spaces application is performing as expected or running slowly. You can drill down to more detailed metrics to troubleshoot problem areas and take corrective action. For guidance on what to look out for, see Section 39.1.3, "Using Key Performance Metric Data to Analyze and Diagnose System Health".
This section describes how to navigate around WebCenter Portal metric pages and includes the following subsections:
-
Section 39.2.1.1, "Monitoring Recent Performance Metrics for the Spaces Application"
-
Section 39.2.1.4, "Monitoring Service Metrics for the Spaces Application"
-
Section 39.2.1.3, "Monitoring Page Metrics for the Spaces Application"
-
Section 39.2.1.5, "Monitoring All Metrics Through the Metrics Palette"
39.2.1.1 Monitoring Recent Performance Metrics for the Spaces Application
To see how well your Spaces application is currently performing:
-
In Fusion Middleware Control Console, navigate to the home page for Spaces application.
See Section 6.2, "Navigating to the Home Page for the Spaces Application."
-
Check the home page to see whether or not your Spaces application is operating as expected.
For guidance on what to look out for, see Section 39.1.3, "Using Key Performance Metric Data to Analyze and Diagnose System Health".
-
Drill down to more detailed metrics by clicking links on the home page, such as Page Performance, Portlet Availability, Health, and so on.
Alternatively, access detailed recent metrics through the following menu options:
-
WebCenter Portal > Monitoring >Recent Page Metrics
-
WebCenter Portal > Monitoring >Recent Document Metrics
-
WebCenter Portal > Monitoring >Recent Portlet Metrics
-
WebCenter Portal > Monitoring >Recent WebLogic Server Metrics
For more information about the metrics on the these pages, see, "Understanding Page Request Metrics", "Understanding Document Metrics", "Understanding Portlet Producer Metrics", and "Understanding WebLogic Server Metrics".
-
39.2.1.2 Monitoring Space Metrics
To access performance metrics for spaces created in the Spaces application:
-
In Fusion Middleware Control Console, navigate to the home page for Spaces application.
See Section 6.2, "Navigating to the Home Page for the Spaces Application."
-
From the WebCenter Portal menu, select Monitoring > Overall Space Metrics.
To learn more about the metrics displayed, see "Understanding Space Metrics". See also, Section 39.1.4, "Understanding Some Common Performance Issues and Actions".
-
Drill down to detailed page metrics for a particular space or compare a specific set of spaces:
-
To see detailed performance information for a specific space:
In the Space Name Filter field, enter the name of a space, then press [Enter]. For information about space filtering options, see "Understanding Space Metrics"
OR
In the Name column, click the space name (link) for which you want to display performance metrics.
In both cases, page metrics for the selected space display.
-
To compare the performance of one or more spaces, select one or more rows in the table, and select Display in Chart.
-
39.2.1.3 Monitoring Page Metrics for the Spaces Application
To access page metrics:
-
In Fusion Middleware Control Console, navigate to the home page for the Spaces application.
See Section 6.2, "Navigating to the Home Page for the Spaces Application".
-
Review page availability/performance charts on the home page to see whether page requests are currently responding as expected.
To drill down to more detailed information, click Page Availability, Page Performance, or select Monitoring > Recent Page Metrics. For more information about the metrics displayed, see "Recent Page Metrics".
-
To monitor page performance since start up, select Monitoring > Overall Page Metrics.
You can view metrics for a particular page, all pages, or a specific set of pages. For more information about the metrics displayed and page filtering options, see "Overall Page Metrics".
-
To monitor the performance of the Page service, select Monitoring > Overall Service Metrics and then click Pages in the table.
For information about the metrics displayed, see "Page Operation Metrics".
39.2.1.4 Monitoring Service Metrics for the Spaces Application
To access service metrics for the Spaces application:
-
In Fusion Middleware Control Console, navigate to the home page for the Spaces application.
See Section 6.2, "Navigating to the Home Page for the Spaces Application".
-
From the WebCenter Portal menu, select Monitoring > Overall Service Metrics.
Use Services Summary at the top of the WebCenter Portal Service Metrics page to quickly see which services are up and running, and to review individual and relative performances of those services used by Spaces application.
Metrics become available when a service, application, or portlet is accessed for the first time. If a service is not configured or has never been used it will not appear in the Summary table.
-
Click the name of a service to drill down to more detailed metrics.
To learn more about individual metrics, see Section 39.1.12.2, "WebCenter Portal Service-Specific Metrics". See also, Section 39.1.12.3, "WebCenter Portal Service-Specific Issues and Actions".
39.2.1.5 Monitoring All Metrics Through the Metrics Palette
To access and chart any performance metric collected for a Spaces application:
-
In Fusion Middleware Control Console, navigate to the home page for the Spaces application.
See Section 6.2, "Navigating to the Home Page for the Spaces Application".
-
From the WebCenter Portal menu, select Monitoring > Performance Summary.
Use the Show Metric Palette button at the top of the Performance Summary page to display the Metric Palette. This palette enables you to select and monitor individual metrics.
-
In the Metric Palette, expand the folders under WebCenter Portal and then select the metric check boxes to monitor the metric in graphical or tabular format.
Figure 39-38 shows the Performance Summary page and Metric Palette. In addition to WebCenter Portal performance metrics, the Metric Palette also displays general performance metrics associated with any J2EE application, for example, ADF Application Module Pool metrics.
To display online help for any metric, right-click the required directory or any metric in the directory and select Help.
Figure 39-38 WebCenter Portal: Spaces - Performance Summary and Metric Palette
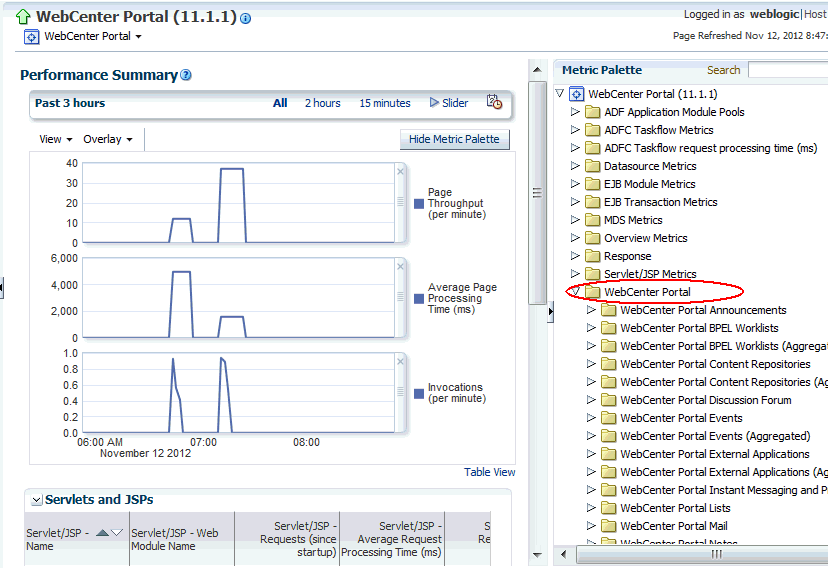
Description of "Figure 39-38 WebCenter Portal: Spaces - Performance Summary and Metric Palette"
39.2.2 Monitoring Framework Applications
Administrators can monitor the performance and availability of all the components and services that make up applications built using WebCenter Portal: Framework, and the application as a whole. These detailed metrics will help diagnose performance issues and, if monitored regularly, you will learn to recognize trends as they develop and prevent performance problems in the future.
This section includes the following subsections:
-
Section 39.2.2.1, "Monitoring Recent Performance Metrics for a Framework Application"
-
Section 39.2.2.2, "Monitoring Service Metrics for a Framework Application"
-
Section 39.2.2.3, "Monitoring Page Metrics for a Framework Application"
-
Section 39.2.2.4, "Monitoring All Metrics Through the Metrics Palette"
39.2.2.1 Monitoring Recent Performance Metrics for a Framework Application
To see how well your Framework application is currently performing:
-
In Fusion Middleware Control Console, navigate to the home page for Framework application.
See Section 6.3, "Navigating to the Home Page for Framework Applications".
-
Check the Response and Load chart to review the latest page performance and verify whether the number of people currently using the application is impacting performance. See also, "Understanding Page Response and Load Metrics".
-
Drill down to more detailed WebCenter Portal metrics through the following menu options:
-
Application Deployment> WebCenter Portal > Recent Page Metrics
-
Application Deployment> WebCenter Portal > Recent Document Metrics
-
Application Deployment> WebCenter Portal > Recent Portlet Metrics
-
Application Deployment> WebCenter Portal > Recent WebLogic Server Metrics
For more guidance on what to look out for, see Section 39.1.3, "Using Key Performance Metric Data to Analyze and Diagnose System Health".
For detailed information about the metrics on the these pages, see, "Understanding Page Request Metrics", "Understanding Document Metrics", "Understanding Portlet Producer Metrics", and "Understanding WebLogic Server Metrics".
-
39.2.2.2 Monitoring Service Metrics for a Framework Application
To access performance metrics for any WebCenter Portal services that are used in a Framework application:
-
In Fusion Middleware Control Console, navigate to the home page for Framework applications.
See Section 6.3, "Navigating to the Home Page for Framework Applications".
-
From the Application Deployment menu, select WebCenter Portal > Overall Service Metrics.
Use the Services Summary at the top of the WebCenter Service Metrics page to quickly see which services are up and running, and to review individual and relative performances of all the services used by the Framework application.
Statistics become available when a service, application, or portlet is accessed for the first time. If a service is not configured or has never been used it will not appear in the Services Summary table.
-
Click the name of a service to drill down to more detailed metrics.
To learn more about individual metrics, see Section 39.1.12.2, "WebCenter Portal Service-Specific Metrics". See also, Section 39.1.12.3, "WebCenter Portal Service-Specific Issues and Actions".
39.2.2.3 Monitoring Page Metrics for a Framework Application
To access performance metrics for pages displayed in a Framework application:
-
In Fusion Middleware Control Console, navigate to the home page for Framework applications.
See Section 6.3, "Navigating to the Home Page for Framework Applications".
-
To see whether page requests are currently responding as expected, select Application Deployment > WebCenter Portal > Recent Page Metrics.
Review the recent page availability and performance charts. For more information about the metrics displayed, see "Recent Page Metrics".
-
To monitor page performance since start up, select Application Deployment > WebCenter Portal > Overall Page Metrics.
You can view metrics for a particular page, all pages, or a specific set of pages. For more information about the metrics displayed and page filtering options, see "Overall Page Metrics".
-
To monitor the performance of the Page service, select Application Deployment> WebCenter Portal > Overall Service Metrics and then click Pages in the table.
For information about the metrics displayed, see "Page Operation Metrics".
39.2.2.4 Monitoring All Metrics Through the Metrics Palette
To access and chart any performance metric collected for a Framework application:
-
In Fusion Middleware Control Console, navigate to the home page for Framework applications.
See Section 6.3, "Navigating to the Home Page for Framework Applications".
-
From the Application Deployment menu, select Performance Summary.
Use the Show Metric Palette button at the top of the Performance Summary page to display the Metric Palette. This palette enables you to select and monitor individual metrics.
-
In the Metric Palette, expand the folders under WebCenter Portal and then select the metric check boxes to monitor the metric in graphical or tabular format.
Figure 39-39 shows the Performance Summary page and Metric Palette. In addition to WebCenter Portal performance metrics, the Metric Palette also displays general performance metrics associated with any J2EE application, for example, ADF Application Module Pool metrics.
To display online help for any metric, right-click the required directory or any metric in the directory and select Help.
Figure 39-39 WebCenter Portal: Framework Application - Performance Summary and Metric Palette
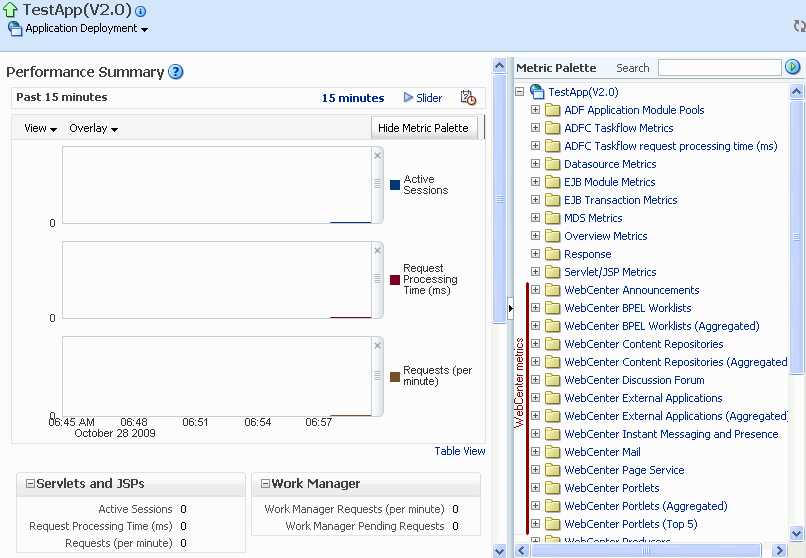
Description of "Figure 39-39 WebCenter Portal: Framework Application - Performance Summary and Metric Palette"
39.3 Customizing Key Performance Metric Thresholds and Collection for WebCenter Portal
This section includes the following subsections:
-
Section 39.3.1, "Understanding Customization Options for Key Performance Metrics"
-
Section 39.3.3, "Configuring Thresholds for Key WebCenter Portal Metrics"
-
Section 39.3.4, "Configuring Thresholds for Document Upload/Download Metrics"
-
Section 39.3.5, "Configuring the Frequency of WebLogic Server Health Checks"
-
Section 39.3.6, "Configuring the Number of Samples Used to Calculate Key Performance Metrics"
39.3.1 Understanding Customization Options for Key Performance Metrics
You can fine-tune how WebCenter Portal collects and reports key performance metrics to best suit your installation in several ways:
-
Customize warning thresholds for key performance metrics
For example, you can specify that in your installation, page response times greater then 15 seconds must trigger a warning message and report an "out-of-bounds" condition in DMS. Out-of-bound conditions also display "red" in WebCenter Portal performance charts to notify you that there is an issue.
For more information, see:
-
Customize how many samples to collect for key performance metrics
If the default sample size (100) is too large or too small for your installation you can configure a more suitable value.
For more informations, see Section 39.3.6, "Configuring the Number of Samples Used to Calculate Key Performance Metrics"
-
Customize health check frequency
If your installation demands a more aggressive schedule you can check the system health more often. The default health check frequency is 5 minutes.
For details, see Section 39.3.5, "Configuring the Frequency of WebLogic Server Health Checks"
39.3.2 Understanding Default Metric Collection and Threshold Settings for WebCenter Portal
You can configure metric collection options and metric threshold settings for WebCenter Portal through the metric_properties.xml file. The default settings are shown in Example 39-1 and highlighted bold.
Note:
All time thresholds are specified in milliseconds. Memory sizes are specified in bytes and CPU usage is specified as a percentage.
Example 39-1 Default Metric Collection and Threshold Settings (metric_properties.xml)
<registry>
 <global_setting>
   <thread_config>
     <thread component_type="oracle_webcenter" interval="5"/>
   </thread_config>
   <health_check_config>
     <health_check name="wlsHealthCheck" enabled="true" collect="1"/>
   </health_check_config>
   <metric_config>
     <metric name="pageResponseTime" type="time" threshold="10000" comparator="gt"/>
     <metric name="portletResponseTime" type="time" threshold="10000" comparator="gt"/>
     <metric name="wlsCpuUsage" type="number" threshold="80" comparator="gt"/>
     <metric name="wlsGcTime" type="number" threshold="undef" comparator="gt"/>
     <metric name="wlsGcInvPerMin" type="number" threshold="undef" comparator="gt"/>
     <metric name="wlsActiveSessions" type="number" threshold="undef" comparator="gt"/>
     <metric name="wlsExecuteIdleThreadCount" type="number" threshold="undef" comparator="gt"/>
     <metric name="wlsActiveExecuteThreads" type="number" threshold="undef" comparator="gt"/>
     <metric name="wlsHoggingThreadCount" type="number" threshold="0" comparator="gt"/>
     <metric name="wlsOpenJdbcConn" type="number" threshold="undef" comparator="gt"/>
     <metric name="wlsHeapSizeCurrent" type="number" threshold="undef" comparator="gt"/>
    /metric_config>
   <custom_param_config>
      <custom_param name="downloadTimeThreshold" value="500"/>
      <custom_param name="downloadThroughputThreshold" value="1024"/>
      <custom_param name="uploadTimeThreshold" value="3000"/>
      <custom_param name="uploadThroughputThreshold" value="180"/>
   </custom_param_config>
  /global_setting>
</registry>
For descriptions of all the settings in this file, refer to the following tables:
-
Table 39-37, "Key Performance Metric Threshold Configuration"
-
Table 39-39, "Document Upload/Download Threshold Configuration"
For information on how to modify the default settings, see "Section 39.3, "Customizing Key Performance Metric Thresholds and Collection for WebCenter Portal".
39.3.3 Configuring Thresholds for Key WebCenter Portal Metrics
You can customize the default warning thresholds for some key WebCenter Portal performance metrics to make them more suitable for your installation. Table 39-36, "Configurable Metric Thresholds" lists key performance metrics you can configure and their default thresholds (if any).
Out-of-the-box, thresholds are only pre-configured for page response (more than 10 seconds), portlet response (more than 10 seconds), and CPU usage (over 80%).
Note:
The value undef means that a threshold is not defined.
You can change for threshold for any of the metrics listed in Table 39-36. For example, by default, pages that take longer than 10 seconds to display trigger a warning message, report an "out-of-bounds" condition in DMS, and show "red" in WebCenter Portal performance charts to immediately notify you when page responses are too slow. Some portal applications might consider 5 seconds to be an acceptable response time, in which case you can change the threshold to 5, 000 (ms) so that your performance charts only show "red" if there really is a problem for you.
Note:
You can set thresholds for document upload and download performance too. For details, Section 39.3.4, "Configuring Thresholds for Document Upload/Download Metrics".
Table 39-36 Configurable Metric Thresholds
| Metric Name | Description | Default Threshold Value | Comparator |
|---|---|---|---|
|
|
Number of milliseconds to render a page. |
10,000 ms |
gt |
|
|
Number of milliseconds to render a portlet. |
10,000 ms |
gt |
|
|
Percentage CPU usage of the WebLogic Server's JVM. |
80% |
gt |
|
|
Average length of time (ms) the JVM spent in each run of garbage collection. The average shown is for the last five minutes. |
undef |
gt |
|
|
Rate (per minute) at which the JVM is invoking its garbage-collection routine. The rate shown is for the last five minutes. |
undef |
gt |
|
|
Number of active sessions on WebLogic Server. |
undef |
gt |
|
|
Number of execute idle threads on WebLogic Server |
undef |
gt |
|
|
Number of active execute threads on WebLogic Server. |
undef |
gt |
|
|
Number of hogging threads on WebLogic Server. |
undef |
gt |
|
|
Number of open JDBC connections on WebLogic Server. |
undef |
gt |
|
|
JVM's current heap size on WebLogic Server. |
undef |
gt |
Metric thresholds are configured in metrics_properties.xml using the format:
<metric_config>
 <metric name="<metric_name>" type="<number/time/string>" threshold="<value>" comparator="gt/lt/eq>"/>
  ...
</metric_config>
Table 39-36 describes each parameter.
Table 39-37 Key Performance Metric Threshold Configuration
| <Metric> Parameter | Configurable | Description |
|---|---|---|
|
|
No |
Name of the metric. The metric name must exactly match the DMS sensor name as listed in Table 39-36. |
|
|
Yes |
Specifies whether the metric is a |
|
|
Yes |
(Only applies when Specifies a numeric threshold value. If specified, you must also specify a For example, if portlet response times greater than 5 seconds are considered out-of-bounds:
Note: Time must be specified in milliseconds. |
|
|
Yes |
Specify one of
|
To edit one or more metric thresholds, follow the steps in Section 39.3.7, "Editing Thresholds and Collection Options for WebCenter Portal (metric_properties.xml)".
39.3.4 Configuring Thresholds for Document Upload/Download Metrics
WebCenter Portal provides several metric parameters that enable you to configure warning thresholds for document upload and download performance in your WebCenter Portal application (see Table 39-38).
Table 39-38 Configurable Document Upload/Download Metric Thresholds
| Metric Name | Description | Default Value |
|---|---|---|
|
|
Acceptable download time for a document (in milliseconds):
The default download time threshold is 500ms (0.5 seconds). |
500 ms |
|
|
Acceptable download rate for a document (in Kilobytes per second). This threshold is only applied to document downloads that exceed the |
1024 KB/sec |
|
|
Acceptable upload time for a document (in milliseconds). The default upload time threshold is 3000ms (3 seconds), that is, six times longer than the default download time. |
3000 ms |
|
|
Acceptable upload rate for a document (in Kilobytes per second). This threshold is only applied to document uploads that exceed the |
180 KB/sec |
If your users expect faster upload/download speeds you might want to reduce the default time thresholds or increase the throughput thresholds provided.Document upload and download thresholds are configured in metrics_properties.xml using the format:
   <custom_param_config>
      <custom_param name="<document_threshold_name>" value="<value>"/>
      ...
   </custom_param_config>
Table 39-39 describes each parameter.
Table 39-39 Document Upload/Download Threshold Configuration
| custom_param Parameter | Configurable | Description |
|---|---|---|
|
|
No |
Name of the customizable metric parameter. The names must exactly match the DMS sensor name as listed in Table 39-38. |
|
|
Yes |
Value of the customizable metric parameter. For example, to set a 300ms download time threshold for documents:
|
To edit one or more metric thresholds, follow the steps in Section 39.3.7, "Editing Thresholds and Collection Options for WebCenter Portal (metric_properties.xml)".
39.3.5 Configuring the Frequency of WebLogic Server Health Checks
Out-of-the-box, the general health of the WebLogic Server on which you WebCenter Portal application is deployed is checked every 5 minutes and the results are reported on the "Understanding WebLogic Server Metrics" page.
If your installation demands a more aggressive schedule you can check the system health more often.
Health check frequency is configured in metrics_properties.xml using the format:
<thread_config>
 <thread component_type="oracle_webcenter" interval="<value>"/>
</thread_config>
Table 39-40 describes each parameter.
Table 39-40 Health Check Frequency Configuration
| <thread> Parameter | Default Value | Configurable | Description |
|---|---|---|---|
|
|
|
No |
For WebCenter Portal, the component_type is always |
|
|
|
Yes |
Specifies the interval between health checks, in minutes. For example:
|
To change the frequency, follow the stpes in Section 39.3.7, "Editing Thresholds and Collection Options for WebCenter Portal (metric_properties.xml)".
39.3.6 Configuring the Number of Samples Used to Calculate Key Performance Metrics
WebCenter Portal collects and reports recent performance for several key performance metrics (page, portlet, document, and WebLogic Server) based on a fixed number of data samples. Out-of-the-box, the last 100 samples of each metric type are used to calculate these key performance metrics, that is, 100 samples for page metrics, 100 samples for portlet metrics, and so on.
You can increase or decrease the sample set to suit your installation. If you decide to increase the number of samples you must consider the additional memory cost of doing so, since all the key performance metrics samples are maintained in memory. Oracle recommends that you specify a few hundred at most. See also Section 39.1.1, "Understanding WebCenter Portal Metric Collection".
Note:
Since all "out-of-bounds" metrics are recorded in the managed server's diagnostic log, you can always scan the logs at a later date or time to see what happened in the past, that is, beyond the 'N' metric samples that are temporarily held in memory.
The server startup property WC_HEALTH_MAX_COLLECTIONS determines the number of metric samples collected by WebCenter Portal. If the property is not specified, 100 samples are collected.
To customize the number of samples collected for key performance metrics:
-
Log in to WebLogic Server Administration Console.
-
Navigate to the managed server on which your WebCenter Portal application is deployed.
For WebCenter Portal: Spaces, navigate to Environment> Servers> WC_Spaces.
For Framework applications, navigate to Environment> Servers> <name of the custom managed server>, for example, WC_CustomPortal.
-
Click the Server Start tab.
-
In the Arguments text area, enter the server startup argument
WC_HEALTH_MAX_COLLECTIONSand specify the number of samples you want to collect.For example:
-DWC_HEALTH_MAX_COLLECTIONS=200
Notes:
Separate multiple arguments with a space. For example:
-DWC_HEALTH_MAX_COLLECTIONS=200 -DWEBCENTER_METRIC_PROPERTIES=/scratch/mythresholds/metric_properties.xml
-
Restart the managed server.
39.3.7 Editing Thresholds and Collection Options for WebCenter Portal (metric_properties.xml)
To change WebCenter Portal's metric thresholds and collection criteria:
-
Copy the XML snippet in Example 39-1, "Default Metric Collection and Threshold Settings (metric_properties.xml)" and save it to a text file named
metric_properties.xml. -
Edit metric collection parameters and/or metric thresholds in
metric_properties.xml, as required.Note:
You must consider your machine resources, as well as the system topology and configuration when choosing suitable thresholds for your WebCenter Portal installation. As each installation is different, most metrics do not have default or recommended threshold settings.
A description of all the settings and their defaults (if any) are described in the following tables:
-
Copy the updated
metric_properties.xmlfile to:-
Your DOMAIN_HOME.
-
Another suitable directory.
-
-
Configure the server startup argument
WEBCENTER_METRIC_PROPERTIESto point to the full path of the properties file:-
Log in to WebLogic Server Administration Console.
-
Navigate to the managed server on which your WebCenter Portal application is deployed.
For WebCenter Portal: Spaces, navigate to Environment> Servers> WC_Spaces.
For Framework applications, navigate to Environment> Servers> <name of the custom managed server>, for example, WC_CustomPortal.
-
Click the Server Start tab.
-
In the Arguments text area, enter the
WEBCENTER_METRIC_PROPERTIESargument and specify the full path of the properties file.For example:
-DWEBCENTER_METRIC_PROPERTIES=/scratch/mythresholds/metric_properties.xml
Notes:
If you only specify the file name, WebCenter Portal looks for this file in your DOMAIN_HOME.
Separate multiple arguments with a space. For example:
-DWC_HEALTH_MAX_COLLECTIONS=200 -DWEBCENTER_METRIC_PROPERTIES=/scratch/mythresholds/metric_properties.xml
-
Restart the managed server.
-
39.4 Diagnosing and Resolving Performance Issues with WebCenter Portal
The performance metrics described in this chapter enable you to quickly assess the current status and performance of your WebCenter Portal application from Fusion Middleware Control. When performance is slow, further investigations may be required for you to fully diagnose and fix the issue. For guidance, see Section 39.1.3, "Using Key Performance Metric Data to Analyze and Diagnose System Health".
Some common WebCenter Portal performance issues and actions are described in this chapter:
-
Section 39.1.4, "Understanding Some Common Performance Issues and Actions"
-
Section 39.1.12.3, "WebCenter Portal Service-Specific Issues and Actions"
For more detailed troubleshooting tips relating to performance, see:
Appendix D, "Troubleshooting WebCenter Portal Performance Issues"
39.5 Viewing and Configuring Log Information
All diagnostic information related to startup and shutdown information, errors, warning messages, access information on HTTP requests, and additional information get stored in log files. To learn how to find information about the cause of an error and its corrective action, see the chapter "Managing Log Files and Diagnostic Data" in Oracle Fusion Middleware Administrator's Guide. To learn how to enable diagnostic logging to identify issues, see the section "Configuring Settings for Log Files" in Oracle Fusion Middleware Administrator's Guide.
For Spaces applications, the log file, WC_Spaces-diagnostic.log is stored in the DOMAIN_HOME/servers/WC_Spaces/logs directory.
For Framework applications, the log file is available in the DOMAIN_HOME/servers/ServerName/logs directory. The log file follows the naming convention of ServerName-diagnostic.log. For example, for a managed server, WC_CustomPortal, the logs will be stored in the DOMAIN_HOME/servers/WC_CustomPortal/logs, and the log file name will be WC_CustomPortal-diagnostic.log.
WebCenter Portal Out-Of-Bound Conditions for WebCenter Portal Metrics
Out-of-bound conditions are also logged in managed server diagnostic logs so you can examine historical events at any time. Performance related messages are logged with the message ID prefix WCS-692<nn>and include the metric name, the value, and a message describing the metric that is out-of-bounds. Here are some examples of messages that you might see in server logs for the Spaces application:
[WC_Spaces] [WARNING] [WCS-69251] [oracle.webcenter.system-management] [tid: [ACTIVE].ExecuteThread: '4' for queue: 'weblogic.kernel.Default (self-tuning)'] [userId: weblogic] [ecid: 6356ef0164cbad47:3fe105c5:13b4e847973:-8000-0000000000000031,0] [APP: webcenter#11.1.1.4.0] [DSID: 0000JhEYRT^EgKG_Ix8Dyf1Ghz32000005] pageResponseTime: 22223 ms of PersonalSpace/Activities is out-of-bounds

[WC_Spaces] [WARNING] [WCS-69252] [oracle.webcenter.system-management] [tid: oracle.webcenter.DefaultTimer] [ecid: 0000JhEX92mEgKG_Ix8Dyf1Ghz32000002,0] [APP: webcenter#11.1.1.4.0] wlsCpuUsage: 21.92100394175851 % of WebLogicServer is out-of-bounds

[WC_Spaces] [WARNING] [WCS-69255] [oracle.webcenter.system-management] [tid: [ACTIVE].ExecuteThread: '0' for queue: 'weblogic.kernel.Default (self-tuning)'] [userId: weblogic] [ecid: 6356ef0164cbad47:3fe105c5:13b4e847973:-8000-0000000000000060,0] [APP: webcenter#11.1.1.4.0] [DSID: 0000JhEYRT^EgKG_Ix8Dyf1Ghz32000005] downloadThroughput: 11.63793103448276 KB/sec of 3209 is out-of-bound

[WC_Spaces] [WARNING] [WCS-69253] [oracle.webcenter.system-management] [tid: pool-3-daemon-thread-1] [userId: weblogic] [ecid: 6356ef0164cbad47:3fe105c5:13b4e847973:-8000-0000000000000088,0:16] [APP: webcenter#11.1.1.4.0] portletResponseTime: 20523 ms of Portlet: slowRenderingPortlet from Web Producer pkjpdk is out-of-bounds
This section includes the following sub sections:
39.5.1 Spaces Application Logs
To view log messages for a Spaces application:
-
In Fusion Middleware Control Console, navigate to the home page for the Spaces application.
See Section 6.2, "Navigating to the Home Page for the Spaces Application".
-
From the WebCenter Portal menu, select Logs > View Log Messages.
-
In the Log Messages page, search for warnings, errors, notifications, and so on.
To configure log files for Spaces:
-
In Fusion Middleware Control Console, navigate to the home page for the Spaces application.
See Section 6.2, "Navigating to the Home Page for the Spaces Application".
-
From the WebCenter Portal menu, select Logs > Log Configuration.
-
In the Log Configuration page, in the Log Files tab, configure log settings.
For more information, see the section "Searching and Viewing Log Files" in Oracle Fusion Middleware Administrator's Guide.
39.5.2 Framework Application Logs
To view log messages for Framework applications:
-
In Fusion Middleware Control Console, navigate to the home page for the Framework application.
See Section 6.3, "Navigating to the Home Page for Framework Applications".
-
From the Application Deployment menu, select Logs > View Log Messages.
-
In the Log Messages page, search for warnings, errors, notifications, and so on.
To configure log files for Framework applications:
-
In Fusion Middleware Control Console, navigate to the home page for the Framework application.
See Section 6.3, "Navigating to the Home Page for Framework Applications".
-
From the Application Deployment menu, select Logs > Log Configuration.
-
In the Log Configuration page, in the Log Files tab, configure log settings.
For more information, see the section "Searching and Viewing Log Files" in Oracle Fusion Middleware Administrator's Guide.
39.6 Tuning Oracle WebCenter Portal Performance
Refer to the chapter "Oracle WebCenter Portal Performance Tuning" in the Oracle Fusion Middleware Performance and Tuning Guide for information on tuning the parameters listed in Table 39-41:
Table 39-41 WebCenter Portal Performance Tuning
| Performance Tuning | Parameters | File / Setting |
|---|---|---|
|
Environment |
||
|
JDBC Data Source (settings for |
||
|
|
||
|
|
||
|
|
||
|
|
||
|
|
||
|
|
||
|
|
||
|
(Spaces application only) |
WebCenter Spaces Administration |
|
|
Back-end ComponentsFoot 1 |
||
|
Announcements Service |
|
|
|
Discussions Service |
|
|
|
Instant Messaging and Presence (IMP) Service |
|
|
|
Mail Service |
|
|
|
RSS News Feed Service |
|
|
|
Search Service |
Number of Saved Searches Displayed, Number of Results Displayed, various Timeouts |
|
|
WSRP Producers |
|
|
|
Oracle PDK-Java Producers |
|
|
|
OmniPortlet |
|
|
|
Portlet Service |
|
Footnote 1 Performance of back-end servers, for example, Worklists, Oracle WebCenter Content Server, and so on, should be tuned as described in guidelines for those back-ends.
