
| STA User Interface Guide, v1.0.2 |
| E28380-03 |

|

|

|

|
The following methods are described:
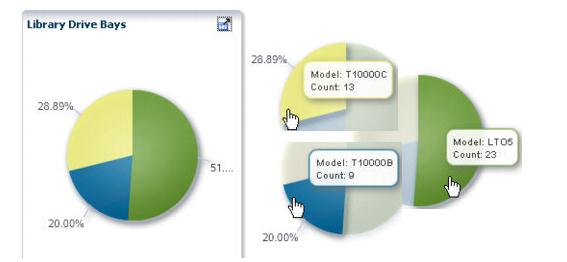
In the example below, the pie chart tooltips yield the count: 13 + 9 + 23 = 45 total.
|
2.
|
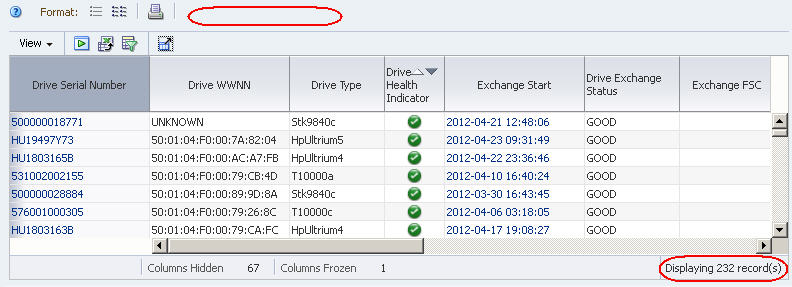
In the example below, no filter has been applied, and the Drives – Overview screen indicates there are 232 total drives monitored by STA.
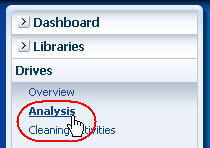
Analysis screens aggregate data according to a variety of criteria.
|
2.
|
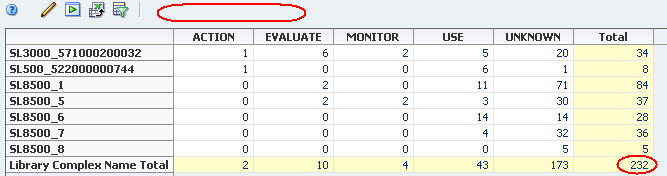
In the example of the Drives – Analysis screen below, no filter has been applied, and the pivot table breaks down the 232 total drives by library complex and state.
|
|
|
|
|

|
| Copyright © 2012 Oracle and/or its affiliates. All rights reserved. | Legal Notices |