Line graphs are used to compare actual values for one or more resources over a period of time. Each line represents a resource (drive or media) or other category of data. Time is always shown on the horizontal axis. Each point on the line represents an actual value at a point in time. There must be at least two data points available for a line graph; if there is only one data point, the graph will display as a bar chart.
Note – The default date range for most STA line graphs (libraries, complexes, drives, and media) is the last 30 days. For exchanges, the default is one day—the current date.
User Action
Description
Display detailed values
Move the mouse over a point in time on a line to display the specific value in a tooltip. Other lines on the graph are dimmed.
Highlight values
Move the mouse over an area of the legend to highlight that line on the graph. All other lines remain on the graph but are dimmed.
Hide values
Clear a legend entry to remove the line from the graph. In this example, the “Written” box on the legend is empty to indicate that the line is hidden on the graph.
Restore hidden values
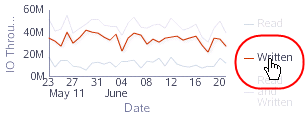
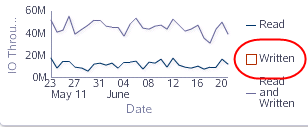
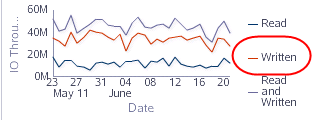
Select a hidden legend entry (“Written”, in this example) to restore the line to the graph.