
| STA User Interface Guide, v1.0.2 |
| E28380-03 |

|

|

|

|
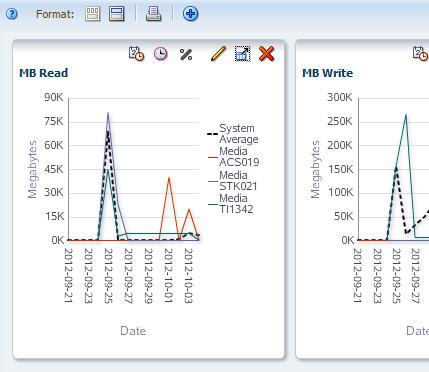
Note – This procedure applies to Overview screens only.
|
1.
|
Add two or more resources to the graph. See “Add Library Resources to Graphs” for detailed instructions.
|
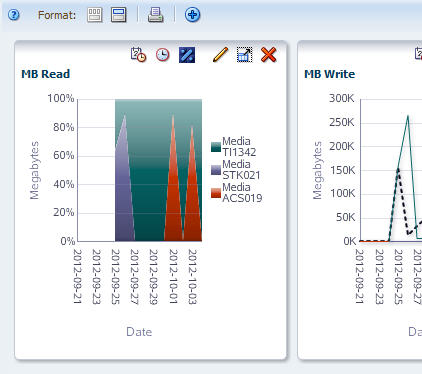
The graphed values change from actual to percent, and the line graph changes to an area chart.
|
|
|
|
|

|
| Copyright © 2012 Oracle and/or its affiliates. All rights reserved. | Legal Notices |