| Oracle® Argus Insight Cognos User's Guide Release 7.0.1 E28481-01 |
|
|
PDF · Mobi · ePub |
| Oracle® Argus Insight Cognos User's Guide Release 7.0.1 E28481-01 |
|
|
PDF · Mobi · ePub |
Argus Insight provides built-in standard reports that you can run on active case series to analyze your company's safety, workflow, and product data.
This chapter includes the following topics:
In addition to the preformatted and predefined standard reports, Argus Insight provides the Report Writer tool that you can use to create custom reports. For more information, see Chapter 9, "Creating Custom Reports."
Although standard reports are predefined reports, you can define pre-filters before generating a standard report to have the report output display information only about specific types of cases. Pre-filters let you narrow down the case series further so that the system runs the report only on those cases that conform to the pre-filter criteria.
For example, suppose your case series consists of cases that were reported in all countries for a particular product. However, you only want information about cases reported in the United States. In this case, you can specify a pre-filter such that the report output includes only those cases that were reported in the United States.
Because a case series might become obsolete each time the data mart is refreshed by running an ETL, you may need to generate the case series again before generating a standard report.
Alternatively, you can directly associate a query (QBE, filter, or advanced condition) to a standard report to avoid manual generation of the case series. For more information, see these topics:
Before using Argus Insight to generate standard reports, configure the browser as defined in the Oracle Argus Insight Installation Guide.
Figure 8-1 shows a sample cover page of the report when it is generated in PDF format. The report cover page has three main sections:
Page header
Page contents
Page footer
You can customize some of the information on the report cover page. The sections that follow provide more information about each component of the cover page.
The page header of the report cover page includes the following information:
Company logo. The upper-left box is a placeholder for a logo. You can configure your company logo to print in this space.
Name of the category to which the selected report belongs. For example, Compliance, Management, or Pharmacovigilance.
Date and time (Greenwich Mean Time [GMT]) that the report was run.
The page contents of the report cover page includes the following information:
Title of the selected report. For example, Destination Report Submission Listing or AE Count Tabulation.
Report subtitle. You configure the subtitle when you run the report. Subtitles are useful in further defining the contents of the report. For example, 01-JAN-2000 to 31-DEC-2012.
Filters defined for the selected report.
MedDRA version used for the selected report.
Start date and time (GMT) of the last successful ETL run.
Count of the total number of unique cases in the case series.
Name of the saved case series on which the report has been executed.
Reports that are run on frozen case series data include the following text next to the case series name on the report:
The data in this report was frozen as of date_and_time.
Time is the database system time with the GMT offset.
Reports that are run on normal case series data include the following text next to the case series name on the report:
The case series was last modified on date_and_time.
Query criteria to get case series on which the report has been executed.
The page footer of the report cover page includes the following information:
Name of the user who executed the report.
Confidential text. You can configure the text that prints in the center of the page footer.
Page number (Page x of y).
In addition, some reports include a placeholder in the footer for another logo. You can configure the image for the logo.
The STANDARD REPORTS page, shown in Figure 8-2, lists all the standard reports built in to Argus Insight.
To display the STANDARD REPORTS page, navigate to Case Series Reports, Standard Reports, and select an option.
The STANDARD REPORTS page displays the following information for each report:
Name of the report.
Brief description of the report.
Date when the report was last modified.
Author of the report. For standard reports, the author is Oracle Corporation.
Category to which the report belongs. For example, Compliance, Management, or Pharmacovigilance.
In addition, the STANDARD REPORTS page provides several standard tools to help you find a specific report or group of reports. You can:
Scroll up and down to browse through the list.
Click a column heading to sort the list.
Enter keywords in one or more column fields and then click Search to find reports that satisfy your specified criteria
To generate a standard report:
Navigate to Case Series Reports and select Standard Reports.
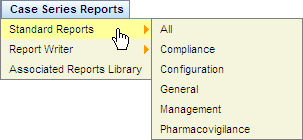
Select the report category, such as Compliance, to view a list of standard reports for that category, or select All to view a list of all the standard reports.
The STANDARD REPORTS page opens and lists the standard reports for the category you selected.
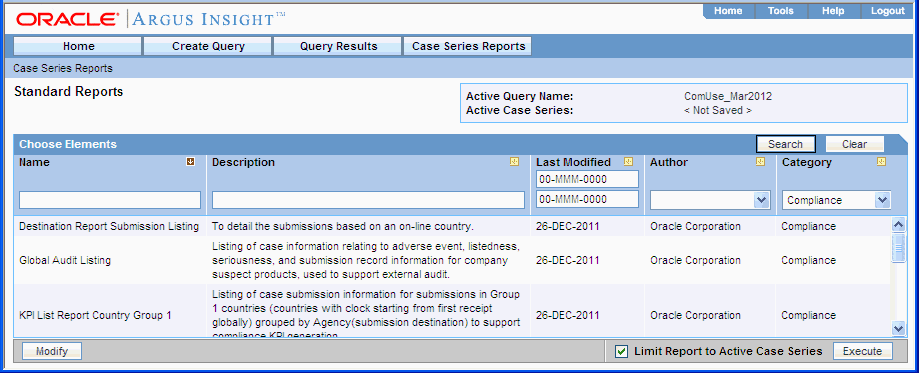
Select the report that you want to generate.
You can scroll through the list to find a report, click a column heading to sort the list, or search for report based on the criteria you specify in the column fields.
Select the Limit Report to Active Case Series check box to generate the report on the active case series only.
Note:
Select the Limit Report to Active Case Series check box before generating the report. This prevents the report from querying the entire data mart and slowing down the report output generation.To view the currently active case series, navigate to Query Results, Case Series, and select Active. To make a different case series active, navigate to Query Results, Case Series, and select Library. When the CASE SERIES LIBRARY page opens, select the case series you want to make active and click Make Active.
Click Execute. The system opens a new browser window that displays the REPORT FILTER/FORMAT OPTIONS page.
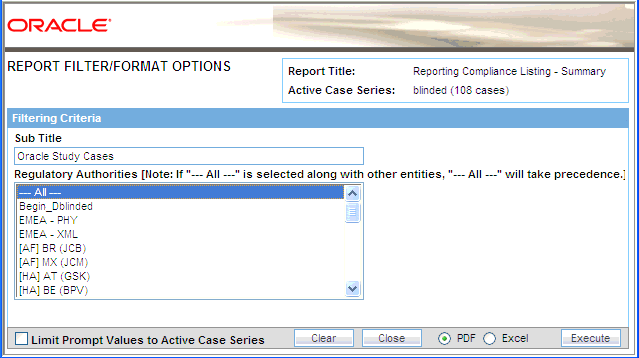
Enter a subtitle for your report in the Sub Title field. The subtitle prints below the title on the report cover page. Subtitles are useful in further defining the contents of the report. Subtitles are not part of the filtering criteria.
Specify your report filtering criteria, as appropriate.
The REPORT FILTER/FORMAT OPTIONS page displays a variety of prompts (in the form of selection lists, check boxes, and fields) that you use to specify filtering criteria for your selected report. The filtering criteria options that are available depends on the type of information in the report. The filtering criteria can include one or more of the following options:
Single selection lists — You can filter the report output by selecting a single value from the list; for example, the country of incidence, a regulatory authority, or a predefined date range. Some lists may contain options for grouping the report output; for example, grouping by age group or product name.
Multiple selection lists — You can filter the report output by selecting one or more values from the list; for example, license countries or report types.
Note:
If you select All along with other entities for a category, the All selection takes precedence. The system will search all items in the category.Fields — You can filter the report output by specifying a numerical value for timelines or dates for date ranges.
Some of the prompts (that is, fields) on the REPORT FILTER/FORMAT OPTIONS page display a list of values from which you can select one or more values. By default, the prompts display values from the List Maintenance tables.
You can select the Limit Prompt Values to Active Case Series check box to generate pre-filter prompts and view values limited to the cases in the case series. This impacts only those prompts that are populated from case tables and the corresponding List Maintenance tables exist for that prompt.
Custom prompts that you create for ad-hoc reporting do not have the option of displaying values in prompts from List Maintenance tables. Custom prompts always display data as per the conditions (SQL) that were defined during the creation of the prompts.
Select the PDF or Excel option to specify the report output format.
Click Execute. The system generates the report and displays the output in the selected format. You can print this report or save it to the system drive, if required.
Close the new browser window to return to the STANDARD REPORTS page.
The reports in Argus Insight focus on cases. This permits event-level reporting in the Argus Insight report output.
Event-level reporting is available for the following Pharmacovigilance standard reports only:
AE Count Tabulation (case causality)
Event Term Frequency Listing by HLGT
Event Term Frequency Listing by HLT
Event Term Frequency Listing by PT
Event Term Frequency Listing by SOC
When you execute one of the standard Pharmacovigilance reports in the previous list, the REPORT FILTER/FORMAT OPTIONS page displays filtering criteria that lets you create an event-level report. See Figure 8-3.
The system populates the event group information from the Event Groups.
You can select multiple Event Groups.
If you select Event Groups, the system limits the report output to only those events selected in the Event Group definition.
Limit to Events within Query Criteria Check Box
If you select the Limit to Events within Query Criteria check box, the system limits the report output to the events chosen in the report output query criteria.
This feature applies to all queries executed from Query By Example, Filters, or Advanced Conditions.
This feature applies for Event Terms for the entire hierarchy (that is, SOC, HLGT, HLT, PT, and LLT for the MedDRA coded events only).
You cannot use this feature with hard-coded SQL queries.
You cannot use this feature with a case series from Argus Safety.
You cannot use this feature with an imported case series.
If you use a power query to generate a case series, the following terms are respected as the event query in the reports:
From Query by Example, Events tab, Event Coding section
System Organ Class (SOC)
High Level Group Term (HLGT)
High Level Term (HLT)
Preferred Term (PT)
Lower Level Term (LLT)
From Filters, Event Information section
Event Term (SOC, HLGT, HLT, PT, LLT)
Preferred Term
From Advanced Conditions
EVENTS, Event Information, Event Body System Code
EVENTS, Event Information, Event High Level Group Term Code
EVENTS, Event Information, Event High Level Term Code
EVENTS, Event Information, Event Included Term Code
EVENTS, Event Information, Event Low Level Term
EVENTS, Event Information, Event SMQ (Broad)
EVENTS, Event Information, Event SMQ (Narrow)
EVENTS, Event Information, High Level Group Term
EVENTS, Event Information, High Level Term
EVENTS, Event Information, Lower Level Term
EVENTS, Event Information, Preferred Term
EVENTS, Event Information, Preferred Term Code
EVENTS, Event Information, System Organ Class (SOC)
EVENTS, Primary Event, Event SMQ (Broad)
EVENTS, Primary Event, Event SMQ (Narrow)
Report packaging is the concept of grouping reports together. You can define multiple reports that are always or often executed at the same time into a group. A set of reports run on a weekly or periodic basis can be scheduled and run as a package.
In Argus Insight, you can associate a report group and the report scheduling to a power query (QBE, Filter Value Set, and Advanced Conditions) or to a case series.
Argus Insight lets you associate the report group, schedule a time to generate the reports, and automatically send the completed reports through email to one or more users that you specify.
Note:
To be able to schedule reports, you must have an enterprise login configured in the Business Intelligence tool (either Cognos or BusinessObjects) you are using with Argus Insight.To associate reports with a query or case series:
You can select any query from any library (Query By Example library, Filter library, Advanced Conditions library, or Query library) and click Associate.
You can select any case series from the CASE SERIES LIBRARY page and click Associate.
You can use the Query library and the Associated Reports library to schedule an association.
Because you can associate multiple reports with a single query, clicking Execute does not open the REPORT FILTER/FORMAT OPTIONS page after generating the case series.
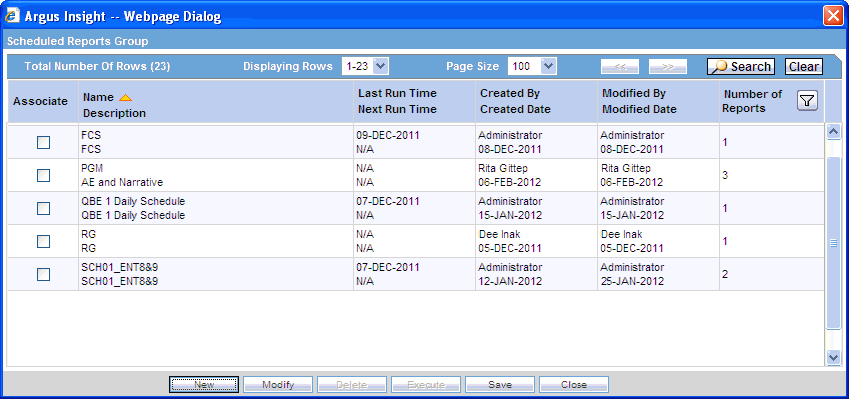
When you select either a query or a case series and then click Associate, the system opens the Scheduled Reports Group dialog box. See Figure 8-4.
The Scheduled Reports Group dialog box displays information about all the report groups created by all the users in the same user group. In a CRO setup or hosting installation, the system displays the report groups specific to the enterprise.
Each group can contain one or more reports. A report group means that all the reports are scheduled for the same time for a power query or a case series.
To view a list of the reports in a group, position the cursor over the group name in the Scheduled Reports Group dialog box. For example:

The Scheduled Reports Group dialog box provides the several tools for viewing, sorting, and searching the report groups. You can:
Use the scroll bar and pagination icons to browse through the list of report groups.
Click a column heading to sort the report groups according to the selected column.
Use the Filter icon to enter search criteria into fields and click Search to find the report groups that match your search criteria. You can click Clear to remove all search criteria. You can click the Close icon to hide the search fields. The search fields are hidden when you open the dialog box.

The Scheduled Reports Group dialog box has the following commands buttons:
Click New to create a new report group. You can select Association only or Scheduling from the context menu. Once you make your selection, the system opens the Reports Scheduling dialog box.

Click Modify to change the settings for an existing scheduled report group.
Click Delete to remove the selected report group. You can delete a report group only if the report group is not associated with a query or case series.
Click Execute to close the Scheduled Reports Group dialog box, and then execute the query/case series in the parent window and open the pre-filter for the selected report. The Execute button is enabled only if the scheduled report group has a single report.
Click Save to save your changes after you associate (or disassociate) a report group by selecting (or clearing) a check box in the Associate column.
Click Close to close the Scheduled Reports Group dialog box.
To associate an existing report group to a selected query or case series:
Navigate to the QUERY LIBRARY page or the CASE SERIES LIBRARY page.
Select the query or case series for which you want to associate a report group.
Click Associate. The Scheduled Reports Group dialog box opens.
Select the check box in the Associate column for the report group that you want to schedule for your selected query or case series. You can associate one or more report groups for your selected query or case series.
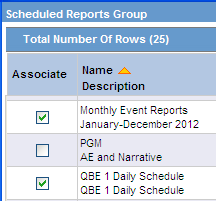
Click Save. The report groups are now scheduled for the selected query or case series.
To remove the scheduling of a report group for a selected query or case series, clear the check box in the Associate column and click Save.
To create and schedule a new report group for a query or a case series:
Navigate to the QUERY LIBRARY page or the CASE SERIES LIBRARY page.
Select the query or case series for which you want to create, schedule, and associate a report group.
Click Associate. The Scheduled Report Groups dialog box opens.
Click New. The system opens a menu with options for associating a report only or for scheduling and associating a report.

Click Scheduling to open the Reports Scheduling dialog box. See Figure 8-5.
See the following sections for information about completing the Reports Scheduling dialog box, including:
The Reports Scheduling dialog box is the main scheduling page in Argus Insight. See Figure 8-5. From this dialog box, you can select any number of reports for scheduling.
The Reports Scheduling dialog box has the following sections:
Group Information
Scheduling Information
E-Mail Information
Available Reports
Selected Reports
In the Group Information section, use the Name and Description fields to enter a title for the report and a brief summary of the report.
In the Scheduling Information section, click the Frequency field to specify how often you want the system to run the selected QBE and generate the selected reports. The options available are Once, Daily, Weekly, Monthly, Quarterly, and Yearly.
Based on the frequency option you select, the Scheduling Information section displays additional parameters that you must specify. For example, if you choose to run the report weekly, the system prompts you to enter the day, the time, the start date, and the end date.
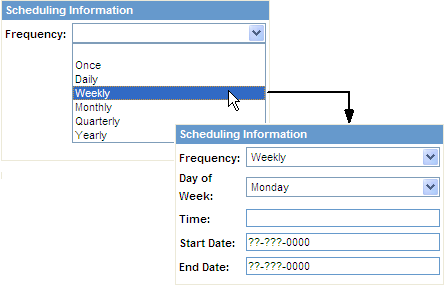
Based on the frequency option you select, enter the additional scheduling information:
Once — Enter the date and time when the system will generate the report.
Daily — Enter the time when the system will generate the report. The system generates the report every day at the specified time. In addition, enter the start date and the end date for this schedule.
Weekly — Select the day of the week when the system will generate the report. In addition, enter the time, the start date, and the end date for this schedule.
Monthly — Select the day (1-31) of the month when the system will generate the report. In addition, enter the time, the start date, and the end date for this schedule.
Quarterly — For reports generated quarterly, the system automatically generates the report on the first day of the quarter. You enter the time of day when the system generates the report, as well as the starting and ending dates.
Yearly — Enter the date and time when the system will generate the yearly report. In addition, enter the start date and the end date for this schedule.
Note:
In the Time field, you must enter the time value in the HH:MM AM/PM format. Hours must be between 1 and 12.If you are scheduling a report group for a case series, you have the option to run the reports immediately. For case series, the Scheduling Information section includes a Run Now check box.
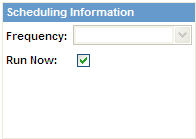
When you select the Run Now check box and save the scheduling information, Argus Insight saves the schedule to execute immediately.
Note that:
The Run Now option is available only when you schedule a report group for a case series.
When you select the Run Now option, all other settings in the Scheduling Information section are disabled. In addition, changes you make in the E-Mail Information section or the Selected Reports section when using the Run Now option do not affect the existing report group information.
The ASSOCIATED REPORTS LIBRARY page does not list the report groups scheduled using the Run Now option.
The Associated Reports Count tooltip on the CASE SERIES REPORTS LIBRARY page does not include Run Now schedules in its count.
The Scheduled Reports Group dialog box displays a new row for each report group schedule that you create using the Run Now option. For example:
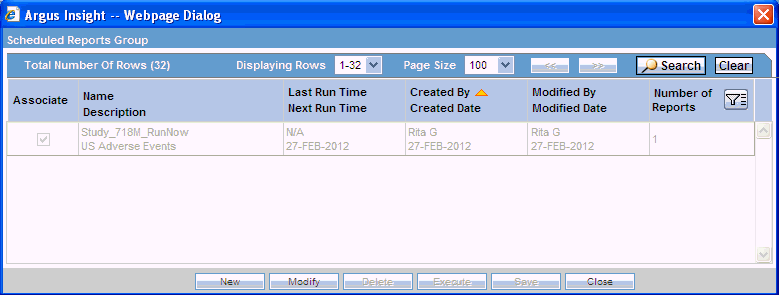
Note that the system:
Appends the _RunNow text to the report group name to indicate that it was scheduled using the Run Now option.
Displays the row in read-only mode (grayed out). You cannot select this row; you cannot perform any operation available in the dialog box on this row.
Displays the row only until all the related scheduling activities are completed.
Makes the row visible only to the user who created the Run Now schedule.
In the E-Mail Information section, enter the email address of each report recipient. If there are multiple recipients, use a semicolon (;) to separate each address.
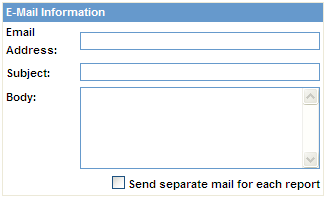
Enter the subject and body text for your email. For example, you may want to include general information about the reports generated, the scope of the report, the time frame of the report, and who to contact for additional information.
You can schedule multiple reports for a single QBE. Be sure to select the Send separate mail for each report check box if you want the system to send an email notification for each report generated.
The Available Reports section lists all the reports that you can include in the schedule and associate with the QBE.
To help you locate specific reports, you can:
Click a column heading to sort the list of reports by the selected column.
Click the Filter icon to display search fields below the column headings, enter one or more values, and then click Search to find the reports that match your criteria.
Scroll up and down to browse through the list.
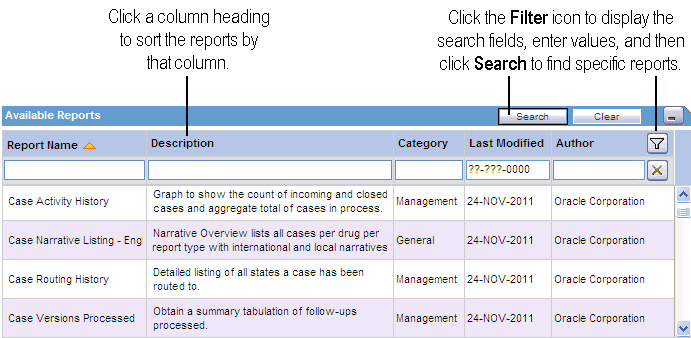
In the Available Reports section, select a report that you want to include in this scheduling and then click Add. The system displays the report in the Selected Reports section. Continue to select and add each report that you want to include in this scheduling.
If you want to remove a report from this scheduling, click the Delete icon. The system prompts for confirmation before deleting the report.
For each report that you select to include in this scheduling, the system displays the report name and category in the Selected Reports section.
You cannot save a schedule without entering the pre-filter information for each report. The system uses the value in the Pre-Filters Configured? column to detect whether you entered the pre-filter information.
To configure the required pre-filters for a report:
Click the report name in the Selected Reports section. The system loads the pre-filter fields into the pane to the right. The pre-filters are specific to the selected report; pre-filters will vary from report to report.
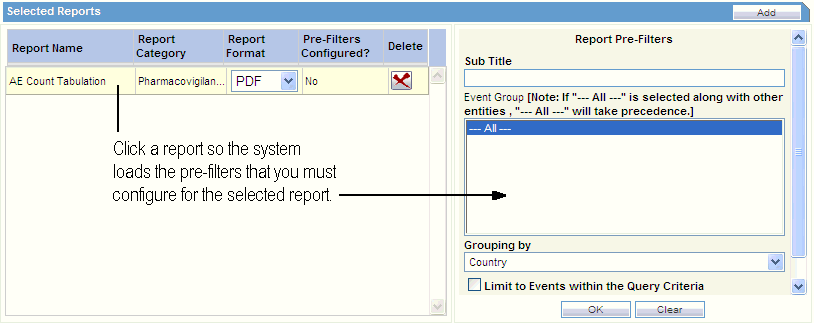
Enter the required information into each field.
Click OK to save your changes to the pre-filter information for the selected report. Note that the system updates the value in the Pre-Filters Configured? column to Yes to indicate you defined the pre-filters for this report.
To reset the pre-filter fields and reenter values, click Clear.
Repeat the procedure to configure the pre-filters for each report included in this scheduling.
In the Report Format column, select the output format for each report. You can select either PDF or Excel.
If you want to remove a report from this scheduling, click the Delete icon. The system prompts for confirmation before deleting the report.
Click OK in the Reports Scheduling dialog box to save your report scheduling.
The system associates the report group with the selected query or case series, saves the scheduling information, and returns to the Scheduled Reports Groups dialog box.
Note that the system automatically selects the Associate check box in the Scheduled Reports Groups dialog box to indicate that reports are associated with the query or case series. Position the cursor over the report name to list the associated reports.
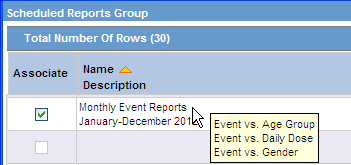
Close the Scheduled Reports Groups dialog box to return to the starting library page. Note that the Associated Report column now displays an icon to indicate that reports are associated with this query or case series. Position the cursor over the icon to display the number of reports associated.
Navigate to Case Series Reports and select Associated Reports Library to display the ASSOCIATED REPORTS LIBRARY page, which is the main status page for all scheduled reports.
You can see all reports in different/same groups at the same time. For example, if you have two (2) report groups with three (3) reports in each group, the library has six (6) rows, one for each report association. The Status column displays the current status of the reports association.
From the ASSOCIATED REPORTS LIBRARY page, you can click Associate To All Cases to schedule reports without a query. The system opens the Scheduled Report Groups dialog box so you can select any number of reports for scheduling. See "Working in the Reports Scheduling Dialog Box" for more information.
By default, the button is labeled Associate To All Cases. However, if you have access privileges to the List Maintenance tab on the ADMINISTRATION TOOLS page, you can customize the text on the button.
The button label uses the following format:
Associate To configured_text
where configured_text is the part of the button label you can customize. The default value is All Cases.
To customize the configured_text on this button:
Click Tools on the global toolbar. The ADMINISTRATION TOOLS page opens.
Click the List Maintenance tab.
Select Profile Switches from the List Maintenance Items section. The system updates the Attributes section with the profile switches that you can configure.
Select ALL CASES QUERY NAME in the Attributes section.
Click Modify. The Modify Attribute dialog box opens.
Enter the text that the system appends to the Associate To text. For example, if you enter All System Cases, the new label for the button is Associate To All System Cases.
Click OK to save your changes.
This section lists the Argus Insight standard reports. The reports are grouped by category; a title and brief description are listed for each report.
Table 8-1 describes the standard Compliance reports.
Table 8-1 Standard Compliance Reports
| Report Title | Description |
|---|---|
|
Destination Report Submission Listing |
Submission details based on an on-line country. |
|
Global Audit Listing |
Case information relating to adverse event, listedness, seriousness, and submission record information for company suspect products. Used to support external audit. |
|
KPI List Report Country Group 1 |
Case submission information for submissions in Group 1 countries (countries with clock starting from first receipt globally) grouped by Agency (submission destination) to support compliance KPI generation. |
|
Reporting Compliance by Grouped Destination (Count) |
Graphical overview of compliance grouped by reporting destination. |
|
Reporting Compliance by Grouped Destination (Percentage) |
Graphical overview of compliance grouped by reporting destination expressed in percentages. |
|
Reporting Compliance Listing - Detail |
Detailed listing of submitted as well as outstanding reports for the selected cases and reporting destinations. The listing is grouped by destination; subtotals and compliance percentages are provided for each destination along with an overall total and total compliance percentages. |
|
Reporting Compliance Listing - Summary |
Summary listing of submitted as well as outstanding reports for the selected cases and reporting destinations. The listing is grouped by destination; subtotals are provided for each destination along with compliance percentage. |
|
Reports Out of Compliance Listing - Detail |
Detailed listing of all reports that were past the due date for the selected cases and reporting destinations. The listing is grouped by reporting destination; subtotals are provided for each destination apart from the overall total. |
|
Reports Out of Compliance Listing - Summary |
Summary listing of all reports that were past the due date for the selected cases and reporting destinations. The listing is grouped by reporting destination; subtotals are provided for each destination apart from the overall total. |
Table 8-2 describes the standard Configuration reports.
Table 8-2 Standard Configuration Reports
| Report Title | Description |
|---|---|
|
ETL Log Argus to Staging Incremental |
ETL log for the latest Argus to Staging ETL incremental process. |
|
ETL Log Staging to Mart Incremental |
ETL log for the latest Staging to Data Mart ETL incremental process. |
|
ETL Log Summary |
ETL summary for all the ETL processes. |
|
Listing of Licenses by Family and Product |
Overview of defined licenses grouped by families. |
|
Listing of Product by Family and Licenses |
Overview of defined products grouped by families. |
|
Reporting Rules Configuration |
List of configured reporting rules. |
|
Study Configuration |
List of configured studies. |
Table 8-3 describes the standard General reports.
Table 8-3 Standard General Reports
| Report Title | Description |
|---|---|
|
Audit Review Listing |
Case information in tabular format relating to adverse event, listedness, seriousness for company suspect products. Used to support internal audit. |
|
Case Narrative Listing - English |
Narrative overview list of all cases per drug per report type with international and local narratives. |
|
CIOMS II Line Listing |
Standard CIOMS II listing report for all cases of the case series. |
|
CIOMS Report |
Standard CIOMS I report for all cases of the case series. |
|
Detailed Line Listing by Case Number |
Case details (suspect drugs, concomitant drugs, events, outcome, indication, narrative, demographics, relevant history) grouped by study number, center number, and patient number, and sorted by case number. Used to support data reconciliation process. |
|
Lot Number Listing - Detail |
Correlation of events for a certain lot number (detailed listing). |
|
Lot Number Listing - Summary |
Correlation of events for a certain lot number (summary). |
|
MSE Review List For Non Serious SR |
Basic case information (events, suspect drugs) — grouped by MSE (based on MSE-drug responsibility configuration) to assist MSE in weekly review of non-serious SR. |
|
MSE Review List for Unrelated CT |
Basic case information (events, suspect drugs) — grouped by MSE (based on MSE-drug responsibility configuration) to assist MSE in weekly review of unrelated CT cases. |
|
SAE Clinical Trial Detail Listing |
Case details (events, demographics, study details, treatment details) — sorted by case number. Used to assist medical investigation. |
|
SAE Clinical Trial Narratives |
Case narratives and study details — grouped by protocol number and sorted by case number. Used to assist medical investigation. |
|
Study Reconciliation Report |
Data-set that lets you reconcile between Argus and the company clinical database. |
|
US FDA MedWatch 3500A |
Standard US FDA MedWatch 3500A report for all cases of the case series. |
Table 8-4 describes the standard Management reports.
Table 8-4 Standard Management Reports
| Report Title | Description |
|---|---|
|
Case Routing History |
Detailed listing of all states to which a case has been routed. |
|
Case Versions Processed |
Summary tabulation of follow-ups processed. |
|
Case Volume History - Product - All Company Suspect Products |
Overview of case volume by specified time period and broken down by key indicators (Product - All Company Products). |
|
Case Volume History - Product - Primary Suspect Products Only |
Overview of case volume by specified time period and broken down by key indicators (Product - Primary Suspect Only). |
|
Case-Load |
Graphical representation of cases in each workflow state. |
|
Case-Load Listing |
List of the number of cases received and processed per workflow state for a given time period. |
|
Event Comparison of Three Periods |
List of events (diagnoses) over three time periods and comparison of these different time periods in one document including labeledness. |
|
Follow-up Status Listing |
List of cases requiring follow-up and the status of those cases. |
|
Open Action Items Listing |
List of cases with open action items by responsible group. |
|
Receipt Latency of Cases by Site - Initial and All Follow-ups |
List of latency from initial receipt date to central received date for initial and follow-up reports. |
|
Receipt Latency of Cases by Site - Initial and Significant Follow-ups |
List of latency from initial receipt date to central received date for initial and follow-up reports. |
|
Receipt Latency of Cases by Site and Country of Origin |
List of latency from initial receipt date to central received date for initial and follow-ups, broken down by country of origin. |
|
Received AE Reports by Protocol |
List of all cases received grouped by protocol number (Study ID). |
|
Reports by Country |
Graph of number of reports processed — grouped by country of incidence and sorted by descending counts to verify workload, productivity. The counts show the number of case locks (initial or follow-up) for cases originating from that country during the report period. |
|
Reports by Report Type |
Graph of number of reports processed — grouped by report type; such as Spontaneous, Clinical Trial (non-PMS), PMS, or Literature. The counts show the number of case locks (initial or follow-up) during the report period. |
|
Total Case WorkLoad by Site |
List of total number of cases in the system. |
|
Total Case Workload by Site and COI - Init. and Sig. Follow-ups |
List of total number of cases in the system grouped by site and country of origin. |
|
Total Case Workload by Site and COI - Initial and All Follow-ups |
List of total number of cases in the system grouped by site and country of origin. |
|
Total Case Workload by Site Graphical Summary |
Graphical overview of the total number of cases in the system broken down by seriousness. |
|
Workflow Monitoring Report |
List of case workflow milestones and lead times for workflow as well as minimal case information. |
|
Workflow Report - 3 months |
Counts based on groups over three-month periods, based on a selected date range. |
|
Workflow Report - 4 quarters |
Counts based on groups over four quarters, based on a selected date range. |
Table 8-5 describes the standard Pharmacovigilance reports.
Table 8-5 Standard Pharmacovigilance Reports
| Report Title | Description |
|---|---|
|
AE Count Tabulation |
Summary tabulation that displays a count of events and breaks them down by causality. |
|
Clinical Trial Causality Tabulation |
Tabulates the causality assessments for each occurring PT. |
|
Count of Serious Related Cases by Product |
Overview of serious related cases over a given time period. |
|
Event (PT) vs. Age Group |
Analysis of the relationships between two or more attributes. |
|
Event (PT) vs. Gender |
Analysis of the relationships between two or more attributes. |
|
Event (PT) vs. Report Type |
Analysis of the relationships between two or more attributes. |
|
Event Term Frequency Listing by HLGT |
Identifies the frequency of events in descending order, grouped by SOC, HLGT, HLT, or PT. |
|
Event Term Frequency Listing by HLT |
Identifies the frequency of events in descending order, grouped by SOC, HLGT, HLT, or PT. |
|
Event Term Frequency Listing by PT |
Identifies the frequency of events in descending order, grouped by SOC, HLGT, HLT, or PT. |
|
Event Term Frequency Listing by SOC |
Identifies the frequency of events in descending order, grouped by SOC, HLGT, HLT, or PT. |
|
Event vs. Age Group |
Analysis of the relationships between two or more attributes. |
|
Event vs. Daily Dose |
Analysis of the relationships between two or more attributes. |
|
Event vs. Gender |
Analysis of the relationships between two or more attributes. |
|
Mortality Report |
Lists the cases with death details, event details where the patient has had a fatal outcome. Grouped by SOC. |
|
Product Interaction Tabulation |
Summary tabulation that displays a count of the incidence of other products involved in cases. |
|
Quick Signal |
List of the event-reporting rates that might suggest a possible change in the safety profile of a product. |
|
SOC/PT Tabulation (Event Count) |
Comparison of events based on report type. |