7 Audit Trail Information Report (Internal Statistics)
The "Audit Trail Information" report provides statistics on content contributors' activities on a content management site—the actions they performed on assets on a content management site, along with information about the particular users who have performed those actions on the assets (for example, created, edited, or deleted assets in your site). This is the only Analytics report that provides information about internal users and the actions they perform on assets on a content management site.
Audit Trail Information reports are described in this chapter. They are:
7.1 'WebCenter Sites Assets Audit Trail' Report
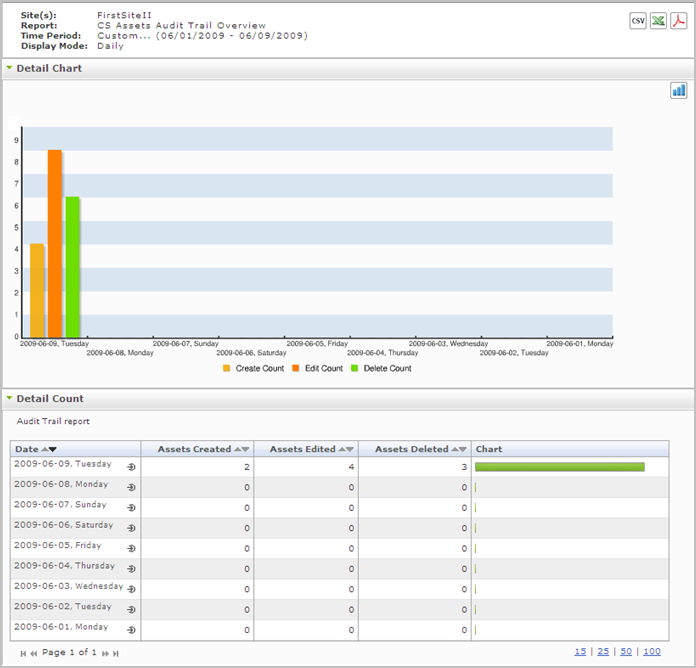
Analytics displays an aggregated count of all assets that have been created, edited, or deleted within a given time period on a given content management site. The report can be generated in four different display modes: Daily, Weekly, Monthly, and Operations on Assets.
Note:
When you select the "Operations on Assets" mode, the "WebCenter Sites Assets Audit Trail" report provides users with a filter which enables a user to filter the report results by asset type and/or asset name.
Figure 7-1 "WebCenter Sites Audit Trail" Report

Description of "Figure 7-1 "WebCenter Sites Audit Trail" Report"
7.1.1 'Detail Chart'
The "Detail Chart" plots the number of times assets were created, edited, and deleted on the content management site, for the given time period.
7.1.2 'Detail Count' List
The "Detail Count" list tabulates statistics of the site's modified assets in the reported time period.
| Mode | Column Title: Description |
|---|---|
|
Daily, Weekly, Monthly |
Date column: The x-axis of the "Details" chart in this mode. Displays the day (week or month) on which assets were created, modified, or deleted.
Clicking the Drill down icon opens the report in the "Operations on Assets" mode (see "Operations on Assets" in this table). Assets Created column: The y-axis of the "Details" chart in this mode. Displays the number of assets that were created on the given date. Assets Edited column: The y-axis of the "Details" chart in this mode. Displays the number of assets that were edited on the given date. Assets Deleted column: The y-axis of the "Details" chart in this mode. Displays the number of assets that were deleted on the given date. Chart column: Horizontal bar whose length represents the total number of assets that have been created, edited, or deleted for the given date. |
|
Operations on Assets |
Created Assets column: Displays a table summarizing all assets that were created in the given time period.(This table provides information about the: asset name, asset type, date of creation, and the user who created the asset.) Edited Assets column: Displays a table summarizing all assets that were modified in the given time period. (This table provides information about the: asset name, asset type, date of modification, and the user who modified the asset.) Deleted Assets column: Displays a table summarizing all assets that were deleted in the given time period. (This table provides information about the: asset name, asset type, date of deletion, and the user who deleted the asset.) |
7.2 'WebCenter Sites Assets' Report
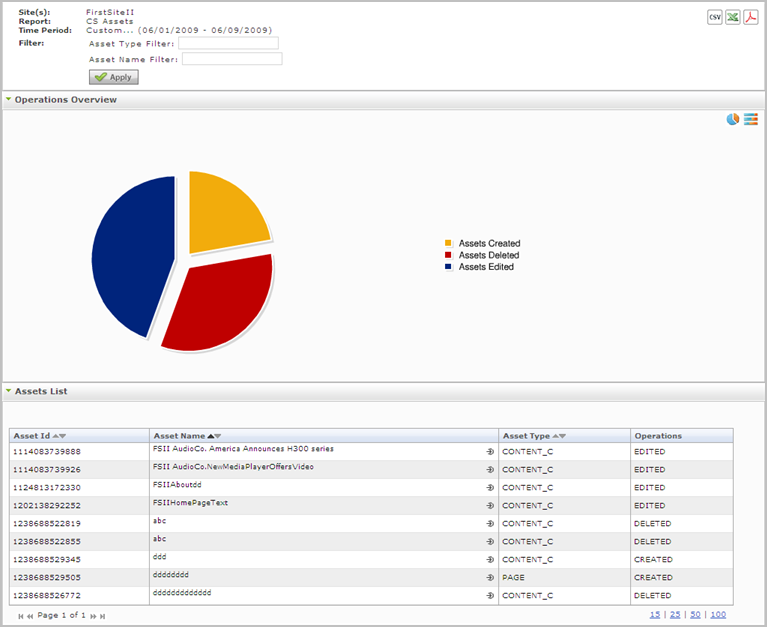
The "WebCenter Sites Assets" report displays statistics on the different operations (create, modify, and delete) that users performed on assets during the reported time period, on the given content management site.
Note:
The "WebCenter Sites Assets" report provides users with a filter which enables the user to filter report results based on asset type and/or asset name.
Figure 7-2 "WebCenter Sites Assets" Report

Description of "Figure 7-2 "WebCenter Sites Assets" Report"
7.2.1 'Operations Overview' Chart
The "Operations Overview" chart displays percentages of different operations (create, modify, and delete) that users performed on assets during the reported time period, on the given content management site.
7.2.2 'Assets List'
The "Assets List" displays a summary of the assets on which operations were performed, and provides information about the operations that were performed on each asset listed.
| Column Title | Description |
|---|---|
|
Asset id |
ID of the asset on which an operation was performed, in the given time period. |
|
Asset Name |
Name of the asset on which an operation was performed, in the given time period. |
|
Asset Type |
Type of asset on which an operation was performed, in the given time period. |
|
Operations |
Type of operation(s) performed on a given asset in the given time period. |
7.3 'WebCenter Sites Users' Report
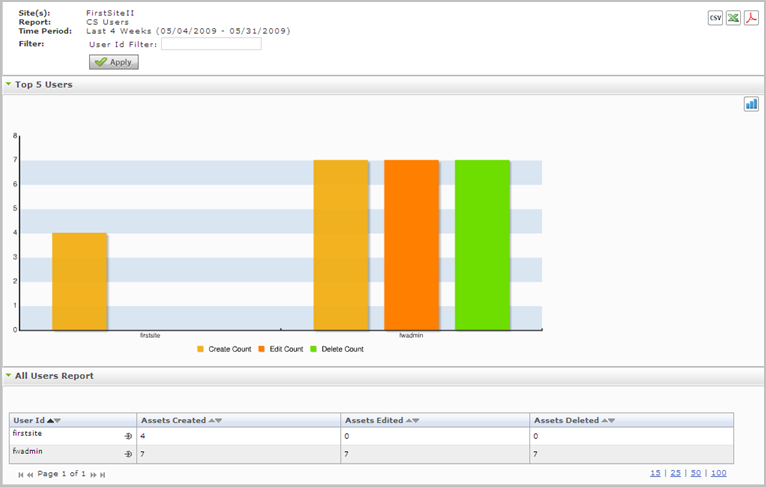
This report displays information about the users who created, edited, or deleted assets in the given time period, on the given content management site.
Note:
The "WebCenter Sites Users" report provides users with a filter which enables a user to filter report results by user Id.
Figure 7-4 "WebCenter Sites Users" Report

Description of "Figure 7-4 "WebCenter Sites Users" Report"
7.3.1 'Top 5 Users' Chart
The "Top 5 Users" chart names the users that performed operations on assets in the given time period. This chart shows which operations the user(s) performed on the asset(s), and how many times the user(s) performed those operations on the asset(s).
7.3.2 'All Users Report" List
The "All Users Report" list displays a table that shows which operation(s) a user performed on an asset, and how many times they performed the operation(s) on the asset in the given time period. For a description of each column of the "All Users Report" list, see the table below.
Table 7-3 "All Users Report" List
| Mode | Column Title: Description |
|---|---|
|
All Users |
User Id column: User name of the user who either: created, edited, or deleted an asset in the given time period. Clicking the Drill down icon opens the report in "User Detail" mode (see the "User Detail" row of this table). Assets Created column: Number of assets a given user created in the given time period. Assets Edited column: Number of assets a given user edited in the given time period. Assets Deleted column: Number of assets a given user deleted in the given time period. |
|
User Detail |
Date column: Day on which the asset was created, edited, or deleted by the user. The date identifies a single day, defined as 24 hours, beginning at 12:00 a.m. on the given date. Time column: The time of day that the user performed the operation on the asset. Asset Name column: The name of the asset that the user performed the operation on. Asset Type column: The asset type of the asset that the user performed the operation on. Asset ID column: The ID number of the asset that the user performed the operation on. Operation Type column: The ID number of the asset that the user performed the operation on. |
