1 Generating Reports
Once content is published, you will want to know about your site visitors' browsing habits. Some types of information—such as most-visited pages, views-per-day, or visitors' countries of origin—will be helpful in making business decisions for tailoring the content of your site more closely to your clients' tastes. Other types of information, such as users' browsers and IP addresses will help you optimize your site technology to reach the widest possible audience.
Analytics plugs into WebCenter Sites to provide you with a comprehensive collection of site traffic information, delivered to you in the form of customizable reports. This chapter explains the different kinds of reports that are available, how to generate the reports, and the types of statistics that are reported.
This chapter contains the following sections:
1.1 Overview
Report generation is permissions-based. Users must have the Analytics role in order to generate reports for the sites they log in to. If this role is not assigned to you, see your WebCenter Sites administrator.
Analytics comes with five report groups:
-
General Information – This report group provides an overview of the traffic on a given site for the latest day, week, month, and year in which data was captured.
-
Content Information – This report group lists which assets have been visited on a given site and how frequently during the reporting period.
-
Engage – This report group provides information about the recommendations that have been made to site visitors and the segments that viewed those recommendations. This report group requires the Engage add-on offering to be installed on WebCenter Sites.
-
User Information – This report group displays:
-
Statistics on visitors of the online site
-
Statistics on the technologies visitors used to browse a given site during the reporting period
-
Session statistics, such as number of sessions in the reporting period, first and final pages to be visited during a session, and URLs that referred visitors to the current site during the reporting period
-
-
Audit Trail Information – This is the only report group that provides internal information about the operations performed on assets in the WebCenter Sites interface. This report group provides an aggregated count of assets that have been created, edited, or deleted in your site, along with information about which users performed those operations on the assets.
For more information about report groups and their individual reports, see Chapter 2, "Report Groups." For information about individual reports, see Chapter 3 to Chapter 7.
For instructions on generating reports, see the section on Section 1.3, "Report Generation Steps."
1.2 Prerequisite Steps
-
Determine whether you have permissions to generate reports. You can either follow the steps in Section 1.3, "Report Generation Steps" or see your WebCenter Sites administrator.
-
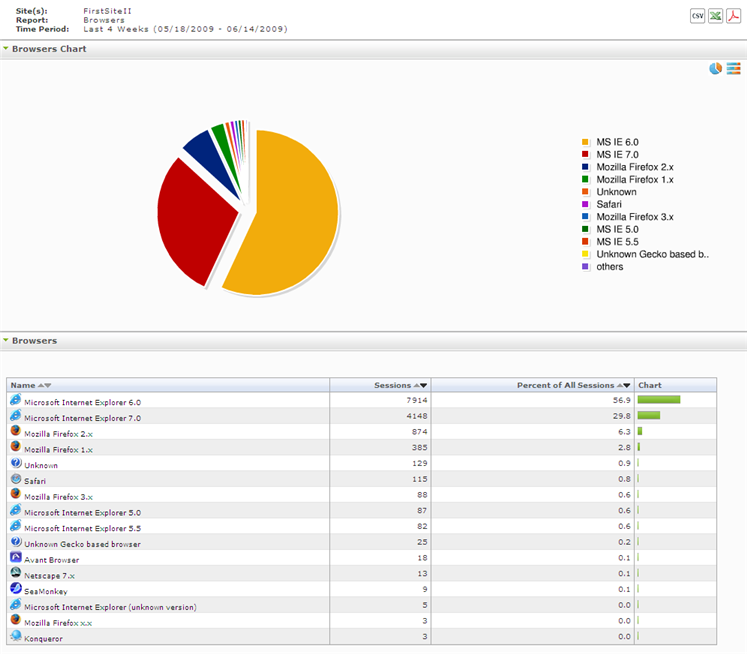
Some reports contain charts (such as the one shown in Figure 1–1). To be displayed, they require Adobe Flash Player to be installed on your local computer. You can obtain a free copy from the following URL and install it before you run reports:
http://www.adobe.com/go/getflashplayerYou can also download a copy after you generate a report with a chart. Simply click the download plugin link that is displayed in place of the chart. When the download is complete, the chart will be displayed.
Figure 1-1 Sample "Browsers" report (identifies browsers used to visit FirstSite II)

Description of "Figure 1-1 Sample "Browsers" report (identifies browsers used to visit FirstSite II)"
1.3 Report Generation Steps
The steps below apply to all WebCenter Sites installations.
Note:
Reports that you generate with Analytics display site traffic statistics, rather than raw data. Because of computation time, the statistics cannot be immediately available for report generation. Availability depends on the data processing schedule, which is configured by the administrator of the Analytics application. For information about data capture and processing, see your Analytics administrator. (A summary about data capture and processing can be found in Section 1.5.2, "Data Processing.")
-
Make sure you have completed Section 1.2, "Prerequisite Steps."
-
Log in to the WebCenter Sites Admin interface and select the site for which you will generate a report.
Note:
Descriptions of default reports are given later on in this guide. For information about custom reports, see your WebCenter Sites administrator.
-
In the top bar of the WebCenter Sites Admin interface, click the Analytics button.
Note:
If the Analytics button is grayed out in your interface, or an error message appears when you click it, stop here. You are not enabled for report generation.
If you need further information about your permissions, see your WebCenter Sites administrator.
The "Analytics" interface opens in a new browser window:
-
Go to the "Report" section of the navigation pane (on the left) to generate the report:
-
From the "Site" menu, select the content management site for which you wish to generate the report.
-
From the "Group" menu, select the group that contains the type of report you wish to generate. If you need descriptions of the report groups, see Chapter 2, "Report Groups."
-
From the "Report" menu, select the report you wish to generate. If you need descriptions of the individual reports, see Chapter 3 to Chapter 7.
-
If the Time Period task bar is displayed, expand it and set the reporting period. You can either choose a pre-set period or specify a custom period by selecting "from-to" dates from the calenders.
-
If the Display Mode task bar is displayed, expand it and select an option. Some or all of the following options are possible, depending on the report:
-
Daily creates a report in "Daily" mode, which displays site traffic statistics for each day in your time period.
-
Weekly creates a report in "Weekly" mode, which displays site traffic statistics for each week in your time period.
-
Monthly creates a report in "Monthly" mode, which displays site traffic statistics for each month in your time period.
-
Sum by Hours creates a report in "Sum by Hours" mode, which lists the average frequency with which a given event on the site occurred during each of the 24 hours. The average is computed over the reported time period.
-
Sum by Weekdays creates a report in "Sum by Weekdays" mode, which lists the average frequency with which a given event on the site occurred during each day of the week (Monday, Tuesday, and so on). The average is computed over the reported time period.
-
Assets creates a report in "Assets" mode, which lists the assets that were visited on the site, or the queries that were made from the site's native search function. This mode also lists usage statistics for the assets and queries. (The "Assets" mode applies to the "Page Views" report.)
-
-
If the Recommendations task bar is displayed (if you selected the "Segments" report, in the "Engage" group), expand it and select a recommendation that was accessed by the segments.
-
-
Generate the report by clicking Apply (in the "Report" panel).
-
Review your inputs and optimize the report as necessary:
-
Specify filtering, if your report supports filtering. (Look for this feature in the report header.)
-
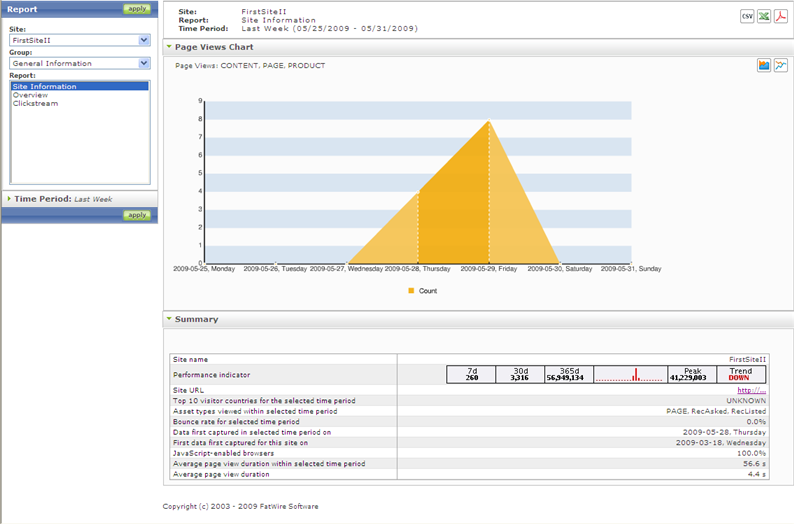
If your report supports a chart, set the chart mode by clicking one of the chart mode icons (in the upper right-hand corner of the report):
-
For line charts, the icons are.

Clicking the first icon creates a chart in which the area under the line is filled in, and a dotted line connects each data point to its value on the x-axis.
-
For pie and bar charts, the icons are:

-
-
-
To save the report data, click one of the following icons (in the upper right-hand corner of the report):
-
The following icon (shown below) saves the report data (without the chart) as a
csvfile (in Microsoft Excel):
-
The following icon (shown below) saves the report data (without the chart) as an
xlsfile (in Microsoft Excel):
-
The following icon (shown below) saves the report (with its chart and format) as a PDF file:

-
-
Once the report is generated, you can do the following:
-
If the report displays a chart, you can toggle between chart modes to replot the data without having to regenerate the report.
-
If you need to print the report, select the browser's File menu and then select Print.
-
-
If you need a description of the report and its statistics, refer to the chapter that corresponds to your report.
1.4 Viewing the Performance Indicator in Asset 'Inspect' Forms
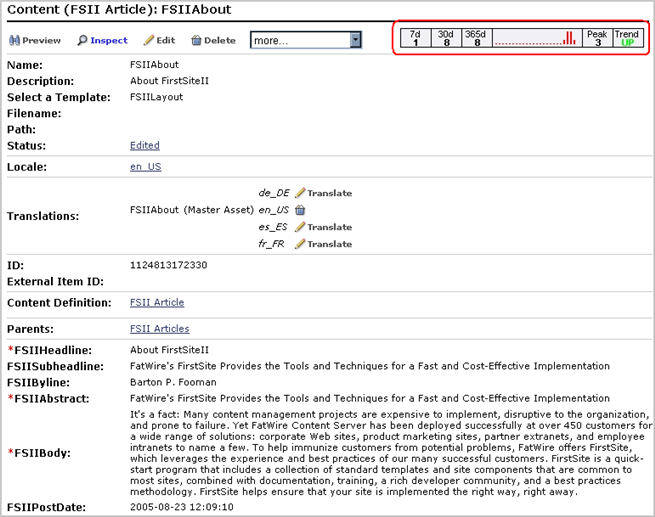
Most Analytics reports display site traffic statistics, rather than raw site traffic data. Some of the statistics are presented in a graph called the "performance indicator," shown below:
The performance indicator is displayed in an asset's "Inspect" form (at the administrator's discretion), so that users of the asset have a quick reference from which to gauge the overall performance of the asset. To view the performance indicator, follow the steps in this section.
Note:
Administrators who need instructions on displaying or hiding the performance indicator can refer to the Oracle Fusion Middleware WebCenter Sites: Analytics Administrator's Guide.
For descriptions of the data in the performance indicator, see Section 3.3.2, "'Summary' List."
1.4.1 Viewing an Asset's Performance Indicator in the WebCenter Sites Contributor Interface
To view an asset's performance indicator in the WebCenter Sites Contributor Interface
-
If you are not sure as to which assets are enabled to display the performance indicator, contact your WebCenter Sites administrator before starting this procedure.
-
Log in to the WebCenter Sites Contributor interface and select the desired site.
-
Locate the desired asset:
-
In the "Search" field, enter search criteria for the desired asset:
-
To narrow down your search to a specific asset type, click the down-arrow to render the "Search Type" drop-down box. Select the asset type to which you want to limit your search. If you do not make a selection, WebCenter Sites will search across all asset types in the current site.
Note:
If you wish to perform an advanced search, click the Advanced Search link in the "Search Type" drop-down box to open the "Advanced Search" form, with additional search criteria.
-
Click the magnifying glass button.
-
In the search results list, click the desired asset.
-
-
In the asset's Inspect view, look for the performance indicator in the upper right-hand corner. If performance data is not available for the asset, you will see the message
"No data available!" and the name of the site.For descriptions of the data in the performance indicator, see Section 3.3.2, "'Summary' List."
Figure 1-5 Performance Indicator Displayed in an Asset's Form

Description of "Figure 1-5 Performance Indicator Displayed in an Asset's Form"
1.5 Availability of Report Statistics
Most of the reports that you generate with Analytics display site traffic statistics rather than raw site traffic data. Because statistical computation takes time, especially on large amounts of data, the results cannot be immediately available for reports. Their availability depends on when the computation is scheduled and how long it lasts.
Typically, computation is performed on the latest 24 hours of site traffic data according to a schedule that makes report statistics available by the time the work day begins. Interested readers can learn more about data capture and analysis in the rest of this section.
1.5.1 Data Capture
As visitors click through your sites, Analytics records each visitor's clicks and the associated information—the date and time of each click, the assets that are clicked, the IP address from which the clicks are issued, the site being visited, and so on. Each piece of information about a site visitor is a piece of raw data (unprocessed data), captured by the sensor. This is the data on which statistics are calculated for display in reports.
Note:
For data capture to take place, several conditions must be met. For example:
-
Asset types hosted on WebCenter Sites sites must be registered with Analytics in order to enable generation of reports on assets of those types.
-
WebCenter Sites pages displaying assets whose asset types are registered must be tagged with data capture code. Otherwise, empty reports will be generated.
In your installation, some asset types might not be registered with Analytics. Some pages might not be tagged for data capture. The decision is related to business requirements and implemented by the WebCenter Sites administrator. For more information, contact your WebCenter Sites administrator.
1.5.2 Data Processing
Once a certain amount of raw data is captured by the Analytics system, it is processed by data analysis jobs into statistical data (such as the average number of requests for a piece of content per unit time). Statistics are injected into the Analytics database, where they are available for reports.
Note:
Data analysis jobs are scheduled by the administrator of the Analytics system in order to shorten report generation time.
Because statistical computation is a resource intensive and time consuming task, it is performed not on-the-fly, each time a report is generated, but on a schedule that makes report data available by the time it is needed. The most efficient schedule for the data analysis job is during off-peak hours (typically at night, when content management operations are negligible and site visits are minimal).
During data analysis, raw data that was captured during the latest period (for example, the past 24 hours) is processed to provide the following information:
-
Current statistics, such as total hits to each site, visiting countries, total number of visits from a given country, types of browsers, and average session duration.
-
Historical results, including:
-
Daily, weekly, and monthly statistics—for example, the total number of requests for a given asset on a given site during a certain month in the reporting period.
-
Yearly statistics—a histogram in the performance indicator (see Section 3.3.2, "'Summary' List") indicating the frequency with which certain assets were accessed during each week of the past year.
-
How long the data analysis jobs run depends on several factors, including site activity within the latest data capture time frame, the cumulative volume of captured data, and the type of computer that is used for analysis. When data analysis is complete, the resulting statistics are available, at any time, for report generation.
Note:
The Analytics database is independent of the database used by WebCenter Sites for content management. The Analytics database is reserved strictly for the storage of statistical data. It does not have the functionality of WebCenter Sites.

