| Oracle® Communications IP Service Activator System Administrator's Guide Release 7.2 E39366-01 |
|
|
PDF · Mobi · ePub |
| Oracle® Communications IP Service Activator System Administrator's Guide Release 7.2 E39366-01 |
|
|
PDF · Mobi · ePub |
This chapter describes how to view and interpret the status of transactions, and the error messages and log information produced by Oracle Communications IP Service Activator.
The component manager startup delay time specifies the period, in seconds, after which the component manager attempts to start IP Service Activator components. A delay time is only applied if the component manager is run as a service.
The default delay time is 0 seconds. You should set a higher value if the Policy Server and the Oracle server are installed on the same host machine. The delay must allow sufficient time for the Oracle server to initialize on a system reboot before the component manager attempts to start IP Service Activator components.
To set the component manager startup delay time:
Using a text editor such as vi, open the cman.cfg file.
The default location of the file is /opt/OracleCommunications/ServiceActivator/Config
Locate the StartupDelay setting and edit with the new value. For example, to set the startup delay time to 30 seconds, enter:
StartupDelay 30
The component manager shutdown timeout period specifies the time, in seconds, after an ipsacm stop command is executed from the command prompt, and before the component manager starts to shut down any IP Service Activator processes that are still running. The default value is 60 seconds (1 minute).
If you want to change this value, we recommend you experiment with timeout values to find one that allows the Policy Server enough time to return to a non-propagating state before shutdown.
The timeout period should be set to a value that allows the Policy Server to shut down in a non-propagating state. Setting too low a value may result in loss of data from the last propagate. The optimum timeout value is dependent on such factors as the size of the database and the number of outstanding calls being made.
Set the component manager shutdown timeout period using the Configuration GUI tool.
You can list IP Service Activator processes by running the ipsaps script, which is installed by default in the /opt/OracleCommunications/ServiceActivator/bin directory. You must be logged in as the ipsaadmin user to run the script.
If you chose not to run the naming service as a service that is started automatically on reboot, you must start and stop it manually.
Note:
Only the IP Service Activator administrator can start and stop the naming service.To start and stop the naming service from the shell:
Log on as the IP Service Activator administrator.
Type one of the commands in Table 6-1:
Table 6-1 Using Commands to Start and Stop the Naming Service
| Command | Function |
|---|---|
$ ipsans start |
Starts the naming service in the background, logging information is recorded in /opt/OracleCommunications/ServiceActivator/logs/ipsans.log |
$ ipsans stop |
Stops the naming service |
To check whether the naming service is running:
Run the ipsaps script:
$ ipsaps
For more information about the ipsaps script, see "Running Troubleshooting Scripts".
If you chose not to run the component manager as a service that is started automatically on reboot, you must start and stop it manually.
To start and stop the component manager from the shell:
Note:
Only the IP Service Activator administrator can start and stop the component manager.The naming service must be running before you can start the component manager.
Log on as the IP Service Activator administrator.
Type one of the following commands:
Table 6-2 Using Commands to Start and Stop the Component Manager
| Command | Function |
|---|---|
$ ipsacm start |
Starts the component manager in the background, logging information is recorded in /opt/OracleCommunications/ServiceActivator/logs/ipsacm.log |
$ ipsacm stop |
Stops the component manager |
To check whether the component manager and other components are running:
As the IP Service Activator administrator, type:
$ ipsaps
The script returns a list of the IP Service Activator component processes that are currently running.
Note:
The naming service and component manager must be running before you can start the user interface.The user interface is run on Windows workstations. Click the IP Service Activator icon, and select the start user interface option.
On startup, the Policy Server performs many integrity validation checks as it loads the object model from the database. No errors occur unless IP Service Activator has been upgraded, or there is a database problem.
A significant period of time is spent checking the validity of parent-child object linkages. When appropriate, you can disable the linkage validation check, and thereby significantly reduce the Policy Server initialization time.
If linkage validation faults are found, a Critical error message (2400 - Linkage errors detected during object model initialization) is reported after the Policy Server starts up.
Setting the Linkage Validation value
Use one of the following two Policy Server command line arguments, typically specified in the cman.cfg file, to change the Linkage Validation setting:
-linkageValidation
+linkageValidation
If neither argument is set, the linkage validation check is Automatic.
The second argument sets the linkage validation check to Enabled.
If both arguments are specified, the linkage validation check is Enabled.
The first argument sets the linkage validation check to Disabled.
Automatic (default): Performs the linkage validation check only if the IP Service Activator version in the database is different than the running version of IP Service Activator. The version includes the release and build number. The linkage validation check is disabled if the versions are the same.
Enabled: Always performs the linkage validation check on Policy Server startup.
Disabled: Never performs the linkage validation check. Error message 2400 will not be generated for any errors.
With the Automatic setting, if a linkage error is found, the Policy Server does not update the IP Service Activator version in the database. This effectively enables the linkage validation check - it forces the Policy Server to re-run the linkage validation check on every Policy Server restart until you fix any errors. You can identify the errors by running the Database Integrity Checker and working with Oracle GCS to solve the errors. For information about running the Database Integrity Checker, refer to "Checking the Integrity of a Database".
Displaying the Linkage Validation setting
Logs indicate whether the Linkage Validation Check is enabled, and whether the IP Service Activator version check is enabled if the Linkage Validation mode is Auto.
You can view the linkage validation setting using ComponentParameters:
% ComponentParameters -ComponentLocation [hostname] -ComponentName master_server -get ObjectModel.Linkage.Validation
The result is as follows:
master_server.server@hostname[version]: $ObjectModel.LinkageValidation=[enabled|disabled|automatic]
For example:
master_server@system4187[5.2.2.84]: $ObjectModel.LinkageValidation=automatic
Enabling the Linkage Validation at upgrade time
In general, if either the object model or the database has been upgraded, the linkage validation setting should be Automatic or Enabled to ensure that the object model is validated as correct for subsequent Policy Server restarts.
An upgrade increments the IP Service Activator version (release and/or build number). For this reason, the Database Integrity Checker (which always performs the Linkage Validation Check) is run before and after an upgrade activity. Note that the version of the Database Integrity Checker (which is given in the first line of its output summary report) must always match the installed version of IP Service Activator.
This section describes how to discover newly-installed system components and start up and shut down components.
The process of checking for new system components is run automatically whenever the policy server is started up. However, if any new system components are added, such as new host systems, you can run the Find System Components command. This queries the naming service to find any new components and update the object model.
To discover and set up new system components:
From the Tools menu, select Find System Components.
New components are located and entered in the object model. You can view them on the System tab in the hierarchy pane.
The default time-out value for the Proxy Agent is 10800 seconds (3 hours). It is a command line parameter and is passed while starting the proxy agent. On Windows you must set it in Registry, and on Solaris/Linux you must set it in cman.cfg file.
To specify a different time-out value, use the following command line parameter for the Proxy Agent:
-gateTimeout <seconds>
You can only restart stopped components from the user interface if the component manager is still running, that is, you used the Shutdown option to shutdown components.
In the System Hosts folder on the System tab, select the appropriate system host and display its property pages.
Click Startup and click OK.
Click the Save button on the toolbar to implement the startup.
When you validate configuration or commit a transaction, IP Service Activator reports any errors in the configuration in the current faults pane. A message may be one of the following types: critical, error, warning, notice, or information. Each message type is color coded for quick reference.
Note:
Best practice: Check the current faults pane after committing each transaction and correct errors that are reported.Figure 6-1 IP Service Activator GUI: Current Faults Pane
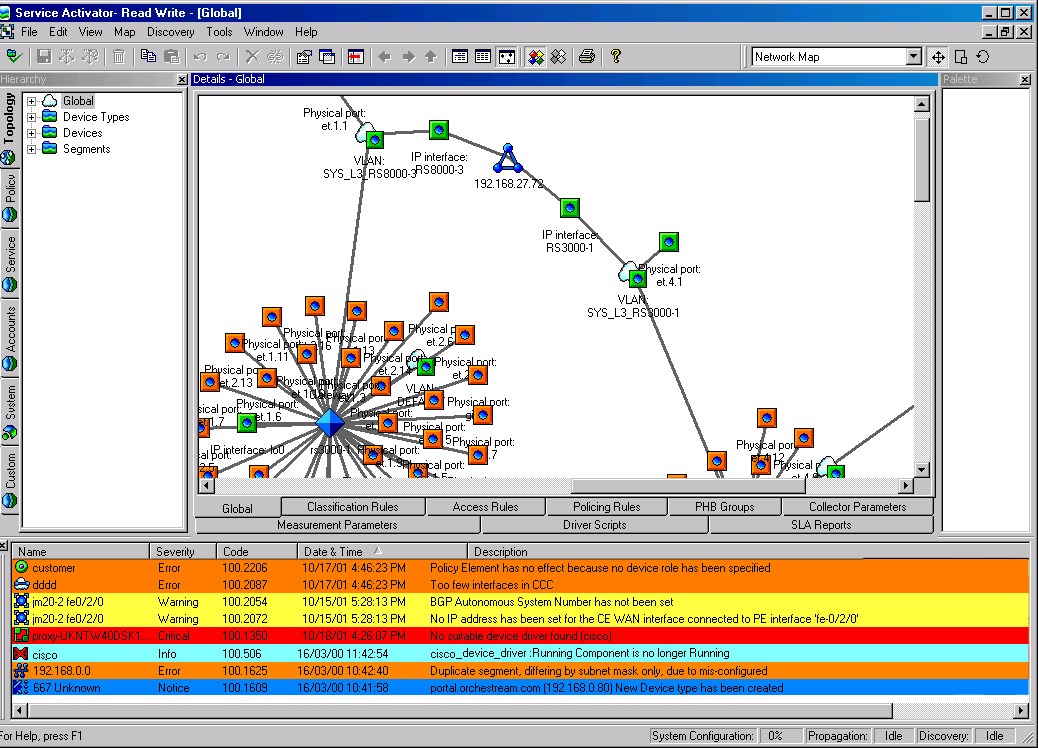
The pane displays information, warning, and error messages. Most of these messages result from network discovery or data validation.
Table 6-3 describes how the background color of a message indicates its type:
Table 6-3 Recognizing Error Message Types
| Color | Description |
|---|---|
|
Red |
Critical faults requiring intervention: failure of an IP Service Activator component or a serious problem with a device. |
|
Orange |
Errors: serious faults in the policy system, but not in a system component. |
|
Yellow |
Warnings, such as validation errors. |
|
Blue |
Notices: some user action is required. |
|
Cyan |
Information only: no user action required. |
For each message, IP Service Activator displays information in the columns shown in Table 6-4:
Table 6-4 Displaying Error Message Information
| Column | Description |
|---|---|
|
Name |
Name of the object in which the fault occurred. Note that the icon of the object also appears. |
|
Severity |
Critical, Error, Warning, Notice or Information, as described above. |
|
Code |
Code number of the message. Numbers prefixed with 100 indicate those generated from IP Service Activator components. |
|
Date & Time |
Date and time that the error occurred. |
|
Description |
Text of the message. |
The online help system provides information on each of the IP Service Activator error messages. You can obtain help on any error message listed in the current faults pane by selecting the error and pressing F1. For each message, the online help describes its type, severity level, description, and suggested action to remove the error.
You can suppress object model warning messages by editing the object model messages xml file. By default, this file is Service_Activator_Install\Config\messages_default.xml
Set suppress="true" for each warning that should no longer be raised. For example:
<ErrorMessage id=”2073” code=”IDS_NO_STATIC_ROUTES_CONFIGURED” text=”Static routing has been chosen for VPNs, but no static routes have been set up” severity=”Warning” suppress=”true”/>
You need to modify this file on each host where the graphical user interface (GUI) is installed, and on the host where the policy server is installed. To implement the change, restart the policy server and each affected GUI instance.
IP Service Activator produces a number of log files that you can use to find out what is happening within the system and to help troubleshoot problems.
Setting up logger messages on Solaris/Linux
Some pre-configuration of Solaris/Linux OS settings is required to manage system logger messages generated by IP Service Activator. See "Additional Setup Tasks to Be Run Prior to Initial Startup" for details.
IP Service Activator produces a number of system logs:
System Message Log: lists all errors, warnings, and information messages reported by the system.
Note:
The System Message Log uses a timestamp based on local time. Other logs use UTC for their timestamps. In order to be able to view System Logs, ODBC must be configured on the Windows GUI machine. The ODBC settings must match the database settings in the cman.cfg file on the Policy Server machine.Device Configuration Log: lists all changes to policy implemented at the devices.
Configuration GUI: Configuration GUI tool client and server logs
Audit Trail: lists changes made to the object model.
Logging is performed by the system logger component, which resides with the policy server. You can control which logs are maintained and how long logged details are kept before being discarded. You can set logging details as a property of the policy server or for each individual log type.
Note:
Note that the System Messages and Device Configuration logs are turned on by default, with a setting of 1 day. The Audit Trail is turned off by default, since maintaining a full audit trail can have an effect on system performance.It is also possible to enable debug log output for components. For more information, see "Generating debug log files for non-Java based IP Service Activator components".
To access the system logs:
On the System tab, open the System Logs folder.
Double-click one of the listed logs to display its content in the details pane.
To set up or change the settings for all system logs:
On the System tab, select the Master Server object.
Select Properties from the pop-up menu.
Select the Logging property page.
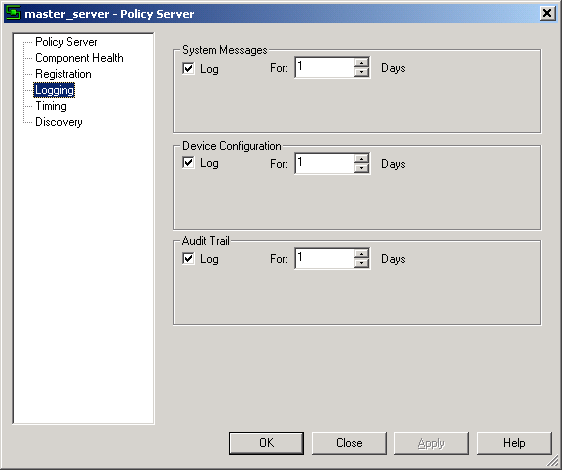
For each log (System Messages, Device Configuration, and Audit Trail), select the Log check box to specify that relevant events are logged. Specify the number of days (in the range 1 to 28) for items to remain in the log before being discarded.
Click OK.
To set up or change the settings for a specific system log:
On the System tab under the System Logs folder, select the object whose log details you want to set.
Select Properties from the pop-up menu.
Select the Log check box to specify that relevant events are logged. Specify the number of days (in the range 1 to 28) for items to remain in the log before being discarded.
Click OK.
The System Message log holds system messages: this includes all errors, warnings, and information messages, apart from data validation messages.
Note:
Current errors and faults, including validation messages, are also reported on the current faults pane. See "Viewing and Understanding Error Messages".To view the System Message log:
In the System tab, System Logs folder, double-click System Message Log.
The log is displayed in the details pane. Messages appear in the order in which they were raised, but you can sort by a selected column by clicking on the appropriate heading.
To refresh the log display, press F5 or select Refresh from the pop-up menu of the log.
For each message, the IP Service Activator system displays the types of information described in Table 6-5:
Table 6-5 The System Message Log Display
| Heading | Description |
|---|---|
|
Time |
The date and time that the message was logged. |
|
Severity |
The severity level of the problem. One of the following: Critical: Indicates a serious fault in a system component or a device, requiring user intervention. Error: Indicates a serious fault in provisioning policy or services. Warning: A less serious fault. Notice: Indicates that some user action is required. Info: Informative message only; no action required. |
|
Message Type |
The type of message. One of the following: Fault: A component has generated a fault. Most faults require some user action in order to fix them. Clear: (specific component or Clear All) An existing fault has been cleared, either by the system or by manual intervention. Message: Reports a system event that generally does not require user action. |
|
Code |
Message code number. Numbers prefixed with 100 indicate those generated from IP Service Activator components. Other prefixes indicate messages originating from components that have not been supplied by IP Service Activator, for example, device drivers produced by a third party. For more information about these messages, contact your software supplier. |
|
Description |
The text of the message. |
Messages are color-coded.
Faults are color-coded according to severity:
Critical faults appear on a red background.
Errors appear on an orange background.
Warnings appear on a yellow background.
Notices appear on a blue background.
Info messages appear on a cyan background
Clears appear on a green background.
Messages appear on a white background.
To display more information about a particular message:
Select it and click F1 or select Help from the pop-up menu.
To update the System Messages window to display the latest messages:
Right-click anywhere in the window and select Refresh from the pop-up menu or press F5 or select Refresh from the pop-up menu of the log.
The Device Configuration Log records all changes made to policy and services; that is, details of the locations and times at which tasks occur, for example:
A concrete rule is installed, uninstalled, or fails
A concrete PHB group is installed, uninstalled, or fails
A concrete VPN is installed, uninstalled, or fails
A concrete CCC is installed, uninstalled, or fails
NetFlow or SAA configuration is installed, uninstalled, or fails
To view the Device Configuration Log:
In the System tab, System Logs folder, double-click Device Configuration Log.
All logged policy changes are listed in the details pane.
For each configuration change, the information in Table 6-6 is displayed:
Table 6-6 The Device Configuration Log Display
| Heading | Description |
|---|---|
|
Date & Time |
Date and time of the configuration. |
|
Event Type |
One of the following: Installed: The configuration has been propagated to proxy agents and successfully installed on the device. Uninstalled: The configuration group has been uninstalled. This can mean that the rule is not currently active (for example, because the date and time or state variable limitations do not apply at present) or the rule has been deleted or disabled by a user. Failed: The proxy agent experienced a failure trying to install the configuration on the device, and it has been discarded. |
|
Device Name |
Name of the device to which configuration has been applied. |
|
Interface |
Name of the interface to which configuration has been applied. |
|
Description |
Type and name of the IP Service Activator object associated with the configuration. |
|
Identity |
Internal ID number of the object. |
To update the Device Configuration log window to display the latest messages:
Right-click anywhere in the window and select Refresh from the pop-up menu or press F5 or select Refresh from the pop-up menu of the log.
Each installed device driver records all device configuration changes that it makes in a specific log file. You can check these log files to see the configuration changes made when policies and services are propagated.
A new log file is created each day. The first transaction after midnight causes a new log file to be created. The same log file is re-used if a device driver is stopped and started within a 24-hour period.
On Solaris/Linux systems, the log files are created in /opt/OracleCommunications/ServiceActivator/AuditTrails
On Windows systems, the log files are created in Program Files\Oracle Communications\Service Activator\AuditTrails
Each file is named as follows:
<day><driver>.audit.log
For example, Tue.juniper.audit.log is the log of configuration changes on Tuesday. After a week, the log files are automatically overwritten, so you should archive them within this period if you want to keep them.
Log files are text files, recording the date, time, and details of each configuration change made to the devices controlled by the device driver. Each time a driver starts, a welcome message is written to the log file. For example:
Automatically generated device audit log
'Thu.JuniperDeviceDriver.audit.log'
Opened Thu Apr 16 08:58:13 2009
Each configuration entry is preceded by the date and time of the change and the IP address of the device to which the configuration was sent. Times are expressed in Coordinated Universal Time (UTC).
Thu Apr 13 11:24:07 2000|192.168.0.203| <config details>
The text logged for configuration changes varies according to the individual device drivers, because the drivers use different mechanisms to communicate with the devices.
The log files for the Configuration GUI are created on the host machine, and are located in the following directories:
On Solaris/Linux:
/opt/OracleCommunications/ServiceActivator/logs
On Windows:
C:\Program Files\OracleCommunications\ServiceActivator\logs
The log files are configToolServer (for server) and configToolClient (for the GUI client).
Based on the LOG_LEVEL parameter in the startup script the logs are captured. The LOG_LEVEL parameter can have any one of the following values:
SEVERE
WARNING
INFO
DEBUG
TRACE
TRACE1
TRACE2
The default level is INFO.
Use the following recommendations to manage the size of the system log files.
The cisco.log,cman.log, cman.log, event_handler.log, integration_manager.log, ipsacm.log, ipsans.log, juniper.log, networkprocessor.log, policy_server.log, proxy.log, system_log.log, unisphere.logusage.log and cman_syslog_error.log files do not grow substantially as you use IP Service Activator.
To manage the size of logs such as policy_server.log, integration_manager.log, system_log.log, proxy.log and the device driver logs, add the following entry to the cman.cfg file:
-debugFileMaxSize <size in bytes>
This section explains how logging is implemented and configured on the Network Processor.
The Network Processor records log files in /opt/OracleCommunications/ServiceActivator/logs and audit logs in the /opt/OracleCommunications/ServiceActivator/AuditTrails directory. There is just one current log file and one current audit file (per cartridge) for each Network Processor. This is different than a server equipped with a Proxy Agent and several Device Drivers, where there are separate log and audit files for each Device Driver. Proxy Agent and Device Driver log files roll over daily, whereas the Network Processor log and audit files roll over when they exceed a configurable maximum size.
The log and audit file format is also different, because the Network Processor logs use the log4j logging utility. This utility allows flexible configuration of logging levels and other logging attributes.
Pre-requisite: The Network Processor is installed and verified.
The Network Processor logger is based on log4j, a Java utility with rich logging capabilities. Using log4j, you can perform logging level filtering, with file rollover based on file size. Procedures for configuring these items are provided later in this section.
The logging.properties file contains the log4j configuration parameters. For details see "Logging Properties".
Note:
For log4j customization information (including formatting the log output, redirecting the log output to stdout or a rolling file), refer to the log4j online documentation:http://logging.apache.org/log4j/2.x/project-info.html.Network processor logs are written to:
/opt/OracleCommunications/ServiceActivator/logs/networkprocessor.log
The default level of logging is at the INFO level, a medium logging level (see "Logging Levels").
Additional log viewer applications, such as Chainsaw version 2.0, may provide more readable output of log records.
The audit trail logs for network processor cartridges record the commands sent to devices. Audit trail logs are written to:
/opt/OracleCommunications/ServiceActivator/AuditTrails/npcartridge_Name.audit.log
The following is an example of part of audit log file:
2009-03-24 04:39:37|#AuditLogging: Opened
2009-03-24 04:39:37|10.156.68.12|#Start Configuration
2009-03-24 04:39:37|10.156.68.12|file-interface|#Applying Configuratio
2009-03-24 04:39:38|10.156.68.12|file-interface|terminal length 0
2009-03-24 04:39:38|10.156.68.12|file-interface|conf t
2009-03-24 04:39:38|10.156.68.12|file-interface|vc-class atm VcClass_
2009-03-24 04:39:38|10.156.68.12|file-interface|ubr 22500
2009-03-24 04:39:38|10.156.68.12|file-interface|exit
2009-03-24 04:39:38|10.156.68.12|file-interface|interface ATM2/0
2009-03-24 04:39:38|10.156.68.12|file-interface|class-int VcClass_0
2009-03-24 04:39:38|10.156.68.12|file-interface|exit
2009-03-24 04:39:38|10.156.68.12|file-interface|alias exec IpsaConfigVersion 2009-03-24T08:39:36.301Z
2009-03-24 04:39:38|10.156.68.12|file-interface|end
2009-03-24 04:39:38|10.156.68.12|file-interface|copy running-config startup-config
2009-03-24 04:39:38|10.156.68.12|file-interface|logout
2009-03-24 04:39:38|10.156.68.12|#End Configuration
[yyyy-mm-dd hh:mm:ss|<mgmt-ip-address>|[delivery-mode-tag|](command|#<status-msg>
where,
yyyy-mm-dd hh:mm:ss: Date and time of the change. Time is expressed in Co-ordinated Universal Time (UTC).
mgmt-ip-address: IP address of the device to which the configuration was sent
delivery-mode-tag: Possible values are:
file-interface or offline-maintenance
no-command-delivery or offline-test
enforce (shown when Command Re-issue feature used)
For more information about delivery mode tags, refer to the Online Help and the "Command Delivery Modes". For more information about the Command Re-issue feature, refer to the Online Help.
command: For some cartridges, commands may actually be multi-line XML fragments or documents.
status-msg: Possible values are:
#AuditLogging: Opened. Cartridge is opened and recognized by the network processor and is ready to log commands.
#Start Configuration. A configuration session is started with the device.
#Applying Configuration. A configuration is being applied to a device.
#Start Enforce. A modification to the device configuration is being started after a command re-issue request
#End Enforce. The modification to the device configuration is finished.
#End Configuration. The configuration session with the device is ended.
#Rollback Configuration. A command delivery error or an error response from the router to a delivered command is encountered. A rollback procedure is initiated, the failing service is quarantined, and an attempt is made to deliver any remaining configuration changes.
Log levels in log4j included items logged at all higher levels. For example, with logging set to the WARN level, items logged include those logged at the ERROR and FATAL levels.
Table 6-7 summarizes usage for each logging level:
| Level | Usage |
|---|---|
|
FATAL |
Very severe errors that will presumably lead the application to crash. For example: Unable to initialize ORB. |
|
ERROR |
Error events that may be recoverable or allow the application to continue. For example: Provisioning of device fails, as well as the rollback. The device is in an 'unrecoverable' state, but the application itself is able to continue and should not interrupt configuration of other devices. |
|
WARN |
Indicates potentially harmful conditions. For example: Received a warning back from the device during configuration. |
|
INFO (default) |
Highlight the progress of the application at a coarse-grained level. For example: Committing a device/transaction. |
|
DEBUG |
Fine-grained events only useful for debugging the application. For example: Indicating the specific steps during the commit: creation of each model, annotation, sending commands to device. |
|
TRACE1 |
Additional information only useful when performing specific debugging tasks which may require more extensive output. For example: Logging of the various models when they are created |
|
TRACE2 |
Only for very fine-grained logging, not normally used since it would flood the logs. For example: Outputting the models during the various stages of their construction. |
To change the Network Processor logging level, or the audit trail logging level, edit the logging.properties file, located in directory /opt/OracleCommunications/ServiceActivator/Config/networkProcessor/com/Oracle/serviceactivator/networkprocessor/.
For example, to change the logging level from Info to Debug, modify the line:
log4j.rootLogger=info, file
to:
log4j.rootLogger=debug, file
Similarly, to change the audit trail logging level from Info to Debug, modify the line:
log4j.logger.com.metasolv.serviceactivator.networkprocessor.AuditLogger=info, audit
to: log4j.logger.com.metasolv.serviceactivator.networkprocessor.AuditLogger=debug, audit
The log files are configured to roll over to a new log file when they reach the maximum file size (MaxFileSize), which you can adjust by editing the logging.properties file. The default network processor log file size is 50 MBytes. The default audit log file size is 8 MBytes.
When maximum file size is reached, the log file is closed, and a new log file is opened to record logs. Each closed log file includes an integer value in its filename. This integer value is incremented for each newly closed log file until the value of MaxBackupIndex is reached. Then the logfilename integer resets to 1, and the previous log file of the same name is over-written. You can adjust the number of previous log files to keep on disk. The default number of previous versions is 1.
It may be appropriate to balance these two parameters to meet your logging requirements. For example, you can choose to store many small log files, or a few large log files.
To adjust log file size and number of previous versions:
To change the Network Processor log file size, or the audit log file size, modify the value of MaxFileSize in the appropriate line of the logging.properties file:
log4j.appender.file.MaxFileSize=8MB
log4j.appender.audit.MaxFileSize=8MB
To change the number of previous versions of the Network Processor log file or the audit log file, modify the value assigned to MaxBackupIndex in the appropriate line of the logging.properties file:
log4j.appender.file.MaxBackupIndex=1
log4j.appender.audit.MaxBackupIndex=1
Note:
Alternatively, you might choose to use the dailyFileAppender for network processor or audit logs. It rolls log files over on a daily basis, so each log file could potentially be large in size. Because log files are not deleted, you might use a lot of storage for the log files if you do not delete them manually.For details, refer to the log4j online documentation: http://logging.apache.org/log4j/2.x/project-info.html
The log output in text form contains several fields that are defined in the logging.properties file. See "Logging Properties" for examples of the field definitions.
The following is a sample output line in the log file and an explanation of the contained fields.
20061206-094547|575|WARN|Thread-0|10.13.4.144|cisco|1002|proxy_np|hostname-1|Pre-Check for Static Route configuration failed: next hop ip 1.1.1.1 is not routable.
20061206-094547: timestamp of when the log was raised.
575: millisecond value of the log timestamp.
WARN: logging level for the specific log.
Thread-0: name of the thread that generated the log.
10.13.4.144: IP address of device to which log applies
cisco: name of the cartridge
1002: Association ID
proxy_np: Component generating log
hostname-1: Server generating log�
The log4j logging configuration is set up in the logging.properties file:
/opt/OracleCommunications/ServiceActivator/Config/networkProcessor/com/Oracle/serviceactivator/networkprocessor/logging.properties
Note:
Do not modify properties in the Internal Use section of the logging.properties file.Refer to the log4j online documentation for details on specific log4j configuration attributes:
The LogReader collates log entries from multiple IP Service Activator components and instantly uploads them into the Oracle database. You must install the LogReader on each IP Service Activator machine where you have at least one component running and whose logs you want to consolidate into the database. The LogReader expects all IP Service Activator component logs to be in the default format - customized formats are not supported.
The LogReader component can be configured using the following property file:
/opt/OracleCommunications/ServiceActivator/Config/java/com/metasolv/serviceactivator/logreader/logCollector.properties
The following are guidelines used to configure the LogReader component:
Oracle Database is the only database supported. JDBC is the only connection mechanism supported.
Choose either the Oracle Database Standard Edition or Enterprise Edition. The default assumption is that you have the Standard edition.
fileRollCheckInterval: This parameter defines how often each input log file should be checked to see if it has rolled over (milliseconds). The default is one minute.
listenSocketPort: This parameter defines where the LogReader should listen for log4j events. The default is 4446. This option should be used with caution since socket-based logging can have a significant performance impact on the logged component.
logLifetime: This parameter defines the number of days logs are kept. The logs for each day is kept in its own partition. The default is seven days.
maintenanceInterval: This parameter defines how often the LogReader should perform database maintenance. This process deletes partitions older than the defined logLifetime parameter. Values can be specified in milliseconds. The default is one hour.
The components for which logs will be collated by the LogReader can be configured using the following property file:
/opt/OracleCommunications/ServiceActivator/Config/java/com/metasolv/serviceactivator/logreader/default.properties
This file is automatically populated during IP Service Activator installation and contains information on all standard components installed on that host. This property file can be modified anytime after the installation. Modifying the property file requires a restart of the LogReader to re-read the property file, which has the following format:
components = <comma separated list of components that are to be monitored: name1,name2>
component.<name1>.name = <component-name>
component.<name1>.filename = <absolute-path-to-component's-log-file>
component.<name1>.newLogFileFormat = <true|false>

component.<name2>.name = <another-component-name>
component.<name2>.filename = <absolute-path-to-second-component's-log-file>
component.<name2>.newLogFileFormat = <true|false>
Example:
components = cman,cman_syslog_error,ipsacm,network_processor
component.cman.name = Component Manager
component.cman.filename = <ServiceActivatorHome>/logs/cman.log component.cman_syslog_error.name = Component Manager Syslog Error component.cman_syslog_error.filename = <ServiceActivatorHome>/logs/cman_syslog_error.log
component.ipsacm.name = ipsacm
<INSTALLATION_DIRECTORY>/ServiceActivator/logs/ipsacm.log component.network_processor.name = Network Processor component.network_processor.filename = <ServiceActivatorHome>/logs/networkprocessor.log
component.network_processor.newLogFileFormat = true
The newLogFileFormat tells the LogReader whether the log file being read is the legacy C++ IP Service Activator format or the new Java IP Service Activator format. If this line is missing, it is assumed to be in the legacy C++ IP Service Activator format. Therefore, you have to add this line only for Java components and set it to true.
The records for the tables are stored in daily partitions based on the insert_date field. The partitions are dropped according to a sliding window specified by the logLifetime property in the: /opt/OracleCommunications/ServiceActivator/Config/java/com/metasolv/serviceactivator/logreader/logCollector.properties file.
Note:
If you choose the database server to be Oracle Enterprise Edition, the partitions are created. If you choose Standard Edition, the records are dropped individually since partitions are not supported.The enhanced logging facility for the Network Processor generates tables in the Oracle Database with the schema shows in Table 6-8.
Table 6-8 Using the Database Schema for LogReader
| Table | Column | Notes |
|---|---|---|
|
logging_event |
insert_date |
date not null |
|
logging_event |
sequence_number |
number(20) not null |
|
logging_event |
timestamp |
number(20) not null |
|
logging_event |
rendered_message |
varchar2(4000) not null |
|
logging_event |
logger_name |
varchar2(254) not null |
|
logging_event |
level_string |
varchar2(254) not null |
|
logging_event |
ndc |
Nested Diagnostic Context, varchar2(4000) |
|
logging_event |
thread_name |
varchar2(254) |
|
logging_event |
reference_flag |
Smallint |
|
logging_event |
caller_filename |
varchar2(254) not null |
|
logging_event |
caller_class |
varchar2(254) not null |
|
logging_event |
caller_method |
varchar2(254) not null |
|
logging_event |
caller_line |
char(4) not null |
|
logging_event |
event_id |
number(10) |
|
logging_event_attribute |
insert_date |
date not null |
|
logging_event-attribute |
event_id |
number(10) not null |
|
logging_event-attribute |
device_ipa |
varchar2(15); default null |
|
logging_event-attribute |
cartridge_name |
varchar2(200); default null |
|
logging_event-attribute |
component_name |
varchar2(100) not null |
|
logging_event-attribute |
host_name |
varchar2(100) default null |
|
logging_event-attribute |
insert_date |
date not null |
|
logging_event-attribute |
event_id |
number(10) not null |
|
logging_event-attribute |
assoc_id |
number(10) not null |
|
logging_event_exception |
insert_date |
date not null |
|
logging_event_exception |
event_id |
number(10) not null |
|
logging_event_exception |
i (this is the stack trace index) |
smallint not null |
|
logging_event_exception |
trace_line |
varchar2(254) not null |
Using the view v_logging_event, you can see all the tables listed above sorted together by the event_id.
All the elements in the table above (with the exception of the entire logging_event_attribute table) come from the log4j standard. More information is available at http://logging.apache.org/log4j/.
The logging_event_attribute table stores non-standard IP Service Activator attributes:
device_ipa: This is the management IP address of the device being operated in the associated log event, if the event can be traced to a particular device. This is applicable only to logs originating from the Network Processor.
cartridge_name: If the log event originates from a particular cartridge or from the framework executing on behalf of a particular cartridge, the cartridge name (as specified in the cartridge registry) will be captured here.
component_name: The name of the IP Service Activator component that generated the log event is stored here.
host_name: The host name of the originating LogReader component is stored here. Because the logs of each component are handled by a co-located LogReader, this is also the hostname of the component that generated this log event.
Records in this table are tied to those in other tables via event_id.
On the IP Service Activator server, the following files in the directory Service_Activator_Home/logs contain entries related to the Network Processor-database software:
networkprocessor.log
logreader.log
upgradetool.log
The logging level for these 4 files is determined by an entry in the following files respectively:
Service_Activator_Home/Config/networkProcessor/com/Oracle/serviceactivator/networkprocessor/logging.properties
Service_Activator_Home/Config/java/com/metasolv/serviceactivator/logreader/logging.properties
Service_Activator_Home/Config/java/com/metasolv/serviceactivator/logwriter/logging.properties
Service_Activator_Home/Config/networkProcessor/upgradeTool/logging.properties
On the Oracle database server where the Network Processor schema is hosted, the ipsa_plsql_dir (example: /opt/OracleCommunications/ServiceActivator/logs) contains daily log files with debug entries generated by the PL/SQL stored procedures in the Network Processor package. These files are named as follows:
YYYYMMDD_np.log (example: 200700518_np.log)
Log file cleanup: routine maintenance task
Periodically, you should clean up these log files. Their size is small, especially if debugging is turned off, so they are unlikely to fill a disk, but you should monitor their size and perform a cleanup as part of your routine maintenance schedule.
The logging level for these PL/SQL logs is stored in the np_debug table as a binary value: 0=off (default on schema creation) or 1=on. When it is turned off, log entries will only be created if an error is encountered.
To determine the current value for the debug log level, enter:
npAdmin.sh get_plsql_debug
To change the debug log level, enter:
npAdmin.sh set_plsql_debug on|off
You can view the list of committed transactions on the System tab under the Transactions folder and specify the number of committed transactions that IP Service Activator maintains in its transactions archive.
If you specify an archive limit, IP Service Activator also applies an upper threshold of 25 for committed transactions over and above the specified limit. The total number of archived transactions is therefore the combined value of the defined archive limit and the hard-coded upper threshold. For example, if you specify an archive limit of 100, IP Service Activator deletes committed transactions only when their number exceeds 125.
Note:
When you set the archive limit, if more than 25 committed transactions are in the archive, none of these transactions will be deleted. This is due to the IP Service Activator application of a hard-coded upper threshold of 25 above the specified archive limit.By default, IP Service Activator maintains information about the last 200 committed transactions. If you lower the limit, any committed transactions above the limit (plus the hard-coded threshold) are permanently deleted from IP Service Activator.
To set the archive limit for transactions:
From the Tools menu, select Options.
The Options dialog box opens.
Select the Transactions property page.
In the Transaction archive limit field, specify a new archive limit.
The default is 200.
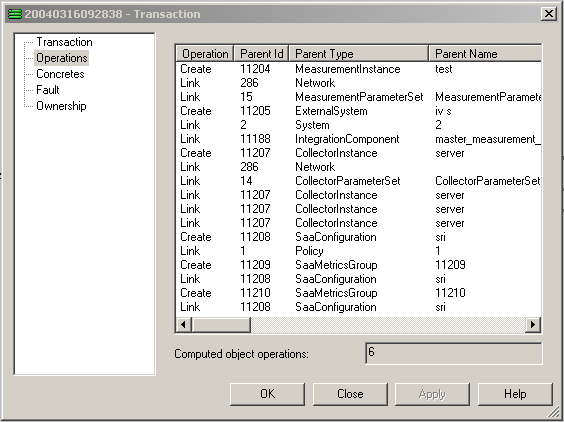
The Audit Trail records all changes made to the system database, that is, creating, deleting, amending or linking objects.
To view the Audit Trail:
In the System tab, System Logs folder, double-click Audit Trail.
The log is displayed in the details pane.
For each entry, the information described in Table 6-9 is displayed:
Table 6-9 The Details Pane Display
| Heading | Description |
|---|---|
|
Date & Time |
Date and time that the user action occurred. |
|
Username |
For user operations, the name of the logged-on user who carried out the operation. For system operations, the name of the policy server. |
|
Op Type |
The type of operation performed: Begin Transaction, Modify, Create, Delete, Link, or Unlink. |
|
Parent Type |
The object affected. For Create, Modify, and Delete operations, this is the object being directly affected. For Link and Unlink, this is the parent object. |
|
Parent ID |
Internal ID number of the Parent Type object. |
|
Child Type |
The internal ID number of the Child object, that is, the object being linked or unlinked. This only appears for Link and Unlink operations. |
|
Child ID |
Internal ID number of the Child Type object, where relevant. |
|
Parameters |
For Create and Modify operations, lists the attributes and values of the affected object. |
To update the Audit Trail window to display the latest messages:
Right click anywhere in the window and select Refresh from the pop-up menu or press F5 or select Refresh from the log pop-up menu.
As transactions are committed in the user interface or via the OIM, the policy server queues the operations they perform and processes each operation in turn. An operation is one of the low-level actions that feature in a transaction – for example, creating an object, or linking one object with another.
You can monitor the content of the database writer queue by:
Specifying a queue size high water mark value: information is written to the operating system log file
Switching on debug logging for the policy server: information is written to the policy server debug log file
Note:
We generally recommend that debug logging is enabled for the policy server only for troubleshooting purposes.By default, users can continue working in the user interface while the policy server processes transactions and saves information to the database. However, it is also possible to run the user interface in ’confirmed commit mode'. In this mode, users cannot commit a transaction until the previously committed transaction has been processed and its changes saved to the database. For more information, see "Running the User Interface in Confirmed Commit Mode".
When the devices/configuration have the same roles, and there are a number of devices in the system, the concrete calculation with device role check is slower than the calculation without device role check. To address this issue, an option called ConcreteDeviceRoleCheck is provided in the database to control the concrete calculation. This option is enabled by default. This implies that the concrete calculation will have device role check. The option can turned off through policy server command line option -ConcreteDeviceRoleCheck disabled or policy server component parameter policyServer.Concrete.DeviceRoleCheck. This is better explained with the following example:
ComponentParameters -ComponentName master_server -set PolicyServer.Concrete.DeviceRoleCheck disabled
It is possible to monitor the number of operations in the database writer queue via the operating system log file. Queue size information is written to the file if the QueueHighWaterMark parameter is specified on the policy server command line. The parameter defines the number of operations that must be in the queue before information is written to the log file.
When the policy server database writer queue reaches the value specified by the QueueHighWaterMark parameter, an operating system logger message is raised and the high watermark level is increased by one.
If the database writer queue reaches the increased value, another operating system logger message is raised and the high watermark level is increased by one, and so on. This information is also stored in the Policy Server log file.
The default high watermark value is 1000.
It is also possible to set the maximum size of the database writer queue. When this maximum is reached, the policy server does not accept new operations into the queue while it processes the backlog. Reaching the maximum limit therefore results in some performance degradation.
The default maximum queue size is 2000.
To set the queue size high water mark and/or maximum queue size:
The queue size high water mark is defined by the following parameter:
-QueueHighWaterMark value
where value is the number of transactions that must be in the database writer queue before the operating system logger error message is raised. The default value is 1000 transactions.
The absolute maximum number of transactions to permit in the queue is defined by the following parameter:
-QueueSize value
where value is the maximum number of transactions permitted in the database writer queue. The default value is 2000 transactions.
On Solaris/Linux platforms, edit the policy server entry in the configuration file cman.cfg in /opt/OracleCommunications/ServiceActivator/Config
For example:
/opt/OracleCommunications/ServiceActivator/bin/policy_server
"-QueueHighWaterMark 1500 -QueueSize 3000 … "
The following information about the database writer queue is written to the policy server when debug logging is turned on for the component:
When an operation is added to the queue the current queue size and total number of operations ever added to the queue is logged.
When an operation is removed from the queue (that is, the operation has been written to the database) the current queue length is logged.
If the maximum queue length is reached (the default is 100) a message is written to the debug log file stating that the queue is full and that some degradation of server performance can be expected.
For information on enabling debug logging for a component, see "Generating debug log files for non-Java based IP Service Activator components".
Transaction status monitoring provides feedback about the success or failure of a transaction so that you can view the status of transactions. See "Viewing Provisioning Statuses" for more information.
The Policy Server sends all the commands for each concrete in a transaction to the Network Processor. The Network Processor runs the commands and determines the success or failure for each transaction.
After the Policy Server receives notification from the Network Processor about all the concretes in the transaction, it automatically sets a provisioning status value for the entire transaction.
Transaction status monitoring monitors a transaction until all the concretes transition from a pending state. Monitored transactions are not deleted as part of the transaction archive limit. See "Setting the Archive Limit for Transactions" for more information.
The following list describes the parameters you can set to configure transaction status monitoring. See "Configuring Transaction Status Monitoring" for information about how to set the parameters.
Timeout Interval: configures the amount of time that IP Service Activator tries to route and monitor a transaction before setting the transaction's provisioning status to timedout. The default value is 900 seconds and the maximum value is 14300 seconds.
Fault Wait Time: configures the amount of time that the Policy Server waits before collecting the faults for a failed transaction. The wait ensures that all relevant faults have propagated to the OSS Integration Manager (OIM). The timer starts when the status of all the concretes in a transaction have changed from pending to either succeeded or failed. The default value is 10 seconds.
Poll Interval: configures how often transaction status monitoring checks the states of the concretes in a transaction. The default value is 60 seconds.
To view the transaction provisioning status:
Commit the transaction. See IP Service Activator User's Guide for details.
Verify that the transaction is committed:
Click the Systems tab.
Select Committed Transactions.
The list of committed transactions appears.
Verify that the transaction appears in the list.
Note:
If the transaction results in a null change (changing something to the value it is already set to), no transaction is generated.Check the transaction provisioning status:
Right-click the transaction and select Properties.
The Properties window appears.
The provisioning status of the transaction is displayed in the Provisioning Status field. Table 6-10 lists the possible provisioning status values of transactions and their meanings.
Table 6-10 Provisioning Status Values
| Value | Meaning |
|---|---|
|
Succeeded |
The Network Processor successfully ran the commands for all the concretes in the transaction and sent the status of each concrete to the Policy Server. The Policy Server set the transaction provisioning status and removed the transaction from its cache. |
|
Failed |
At least one concrete in the transaction was rejected. The Network Processor notified the Policy Server of each affected concrete. The Policy Server set the transaction provisioning status and removed the transaction from its cache. For example, if you generate two transactions that modify the same concrete, the transaction fails because IP Service Activator cannot determine which transaction to update to what status, as one transaction could fail and one could succeed. |
|
Timedout |
The Policy Server did not receive notification from the Network Processor about all of the concretes in the transaction during the maximum time period set by the parameter TransactionMonitoringTimeout. |
|
Pending |
The original state of the committed transaction while the Policy Server is waiting to receive notification about all the concretes in the transaction. |
See "Transaction Troubleshooting" for more information about troubleshooting failed transactions.
Transaction status monitoring can be configured by setting parameters using the command line before IP Service Activator is running, or by setting component parameters after IP Service Activator is running.
To configure transaction status monitoring using the command line:
Set any relevant parameters using the commands listed inTable 6-11. See "About Transaction Status Monitoring" for more information about these parameters.
Table 6-11 Transaction Status Monitoring Command Line Parameters
| Parameter Name | Command Line parameter |
|---|---|
|
Timeout interval |
-TransactionMonitoringTimeout value_in_seconds
where value_in_seconds is the timeout value in seconds |
|
Fault wait time |
-FaultWaitTime value_in_seconds
where value_in_seconds is the fault wait time value in seconds. |
|
Poll interval |
-TransactionMonitoringPollInterval value_in_seconds
Where value_in_seconds is the poll interval value in seconds |
To configure transaction status monitoring after IP Service Activator is running:
Run the component parameter utility.
Set any relevant parameters using the commands listed in Table 6-12. See "About Transaction Status Monitoring" for more information about these parameters.
Table 6-12 Transaction Status Monitoring Component Parameters
| Parameter Name | Component Parameter |
|---|---|
|
Timeout interval |
-ComponentParameters -component_name master_server -setTransactionMonitoring.Timeout value_in_seconds where:
|
|
Fault wait time |
-ComponentParameters -component_name master_server -setTransactionMonitoring.FaultWaitTime value_in_seconds where:
|
|
Poll interval |
-ComponentParameters -component_name master_server -setTransactionMonitoring.PollInterval value_in_seconds where:
|
While a device is managed by IP Service Activator, the proxy agent polls it regularly to check that it is still running. This is true only for device driver technology. There is no equivalent for Network Processor. The status of a device, as reported in the user interface, may change as a result of polling. For example, if a device fails, its status is changed to Unreachable. The device is still polled and is reset when it recovers. If the problem fails to reset, however, or if a critical fault is raised on a device, the status is changed to Intervention Required until the problem is resolved.
The diagram in the section "Viewing the Current Status of IP Service Activator" shows the range of device states and the transitions between them.
Note that initial discovery of a device may be by any of the following routes:
Discovering or creating the device through the user interface
Discovering or creating the device via the OSS Integration Manager (OIM) – see the OSS Integration Manager Guide
You can check the status of the devices and interfaces within a domain by viewing the topology map in status context. Every device and interface state is represented by a display color in the map.
Note:
Devices that are in the Intervention Required state are not automatically managed when the next transaction is committed. You must explicitly re-manage the device before attempting to configure it. Alternatively, you can delete the relevant critical fault from the faults pane, which will re-manage the device.IP Service Activator provides the following status views:
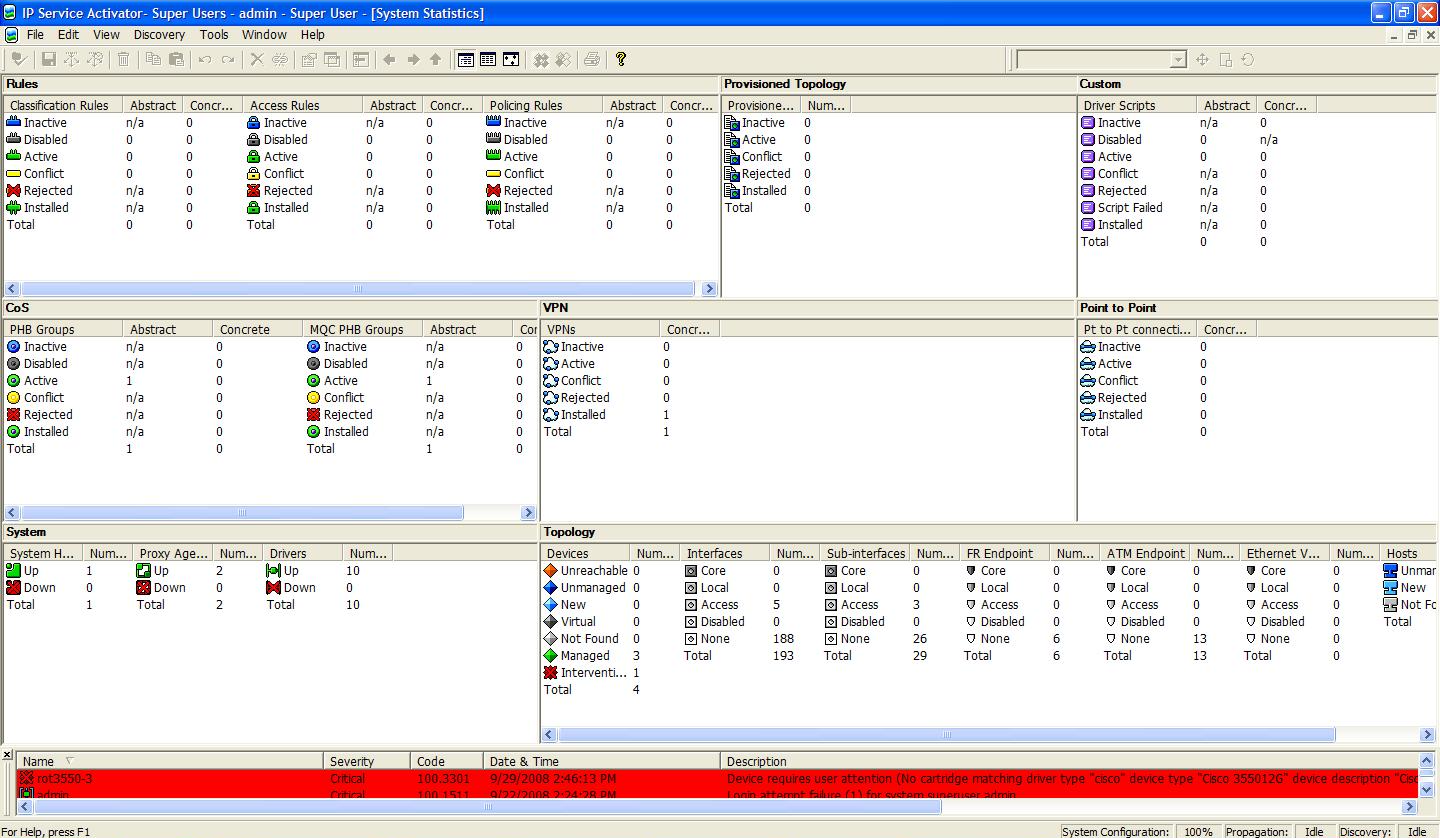
The statistics summary pane summarizes the status of PHB groups, policy rules, CCCs, and VPNs and can be displayed as a dockable toolbar in any window.
The system statistics window provides a single-screen status summary: system components, policy rules, PHB groups, VPNs and CCCs, and network devices.
To view the statistics summary pane:
From the View menu, select Statistics Summary.
For PHB groups, policy rules, VPNs, CCCs and driver scripts the pane displays the number of each object with the following status:
Inactive: the object has been created but has not been propagated to the proxy agents
Disabled: the object has been disabled
Active: the object has been propagated to the proxy agents
Conflict: the object conflicts with an existing object or has failed validation
Rejected: one or more of the objects failed to install
Failed: the proxy agent experienced a failure trying to install the driver script and it has therefore been discarded (driver scripts only)
Installed: an object that has been installed on the designated device
Mismatched: the configuration in IP Service Activator for this concrete does not match the configuration actually on the designated device
Script Failed: the proxy agent experienced a failure trying to install the script and it has therefore been discarded. (The device driver ran the script but encountered an error in it. The device driver will try to run the script again only if it has been set to run repeatedly.)
Uninstalled: the object has been uninstalled. This can mean that the object is not currently active on the device (for example, because the date and time limitations do not apply at present) or the object has been deleted or disabled by a user
UninstallFailed: the object remains on the device, and its concrete is disabled in the GUI. (A fault may be raised.)
To view the System Statistics window:
From the View menu, select System Statistics.
The System Statistics window is displayed in the figure below.
For current classification rules, access rules, and policing rules, the window indicates the number of abstract (parent) and concrete rules that are Inactive, Disabled, Active, Changed, Conflict, Rejected, or Installed.
For PHB groups, the screen indicates the number of abstract (parent) and concrete rules that are Inactive, Disabled, Active, Changed, Conflict, Rejected, or Installed.
For VPNs and CCCs, the screen indicates the number of concrete VPNs or CCCs that are Inactive, Active, Conflict, Rejected, or Installed
For system components (hosts, proxy agents and device drivers) it indicates the number that are Up or Down.
For devices, it indicates the number that is currently in each state: Unreachable, Unmanaged, New, Not Found, Managed, or Intervention Required.
For interfaces, it indicates the number of interfaces whose role is Core, Local, Access, Disabled, or None.
Note that the Interfaces pane shows the number of interfaces or sub-interfaces assigned to each role. If an interface has no sub-interfaces, its role assignment is added to the count. If an interface has one or more sub-interfaces, each sub-interface role is counted and the role of the parent interface is not.
For hosts, it indicates the number that are New, Unmanaged, or Not Found.
Perform this procedure only if there is a firewall between the IP Service Activator GUI and the Network Processor server. Use this procedure to allow GUI access to the CORBA port assigned to the Network Processor, so the GUI can send device configuration audit results to the Network Processor.
The device configuration audit is performed in the expert GUI, on the Device dialog, Audit page. For more information about running a device configuration audit, refer to the IP Service Activator Online Help.
If you do not perform this setup procedure before initiating an audit on any cartridge-driven device, the GUI returns an error message stating it is unable to connect to the Network Processor.
To permit access from the GUI to the Network Processor:
Work with your network administrator to perform the following tasks:
Choose a port number for Network Processor GUI connectivity.
Ensure your choice of port does not conflict with ports used by other network services running on the Network Processor servers.
Open the firewall at the chosen port.
Perform this step on each server where the Network Processor component is installed:
Start the Configuration GUI. See "Running the Configuration GUI".
Click BaseHost, Network Processor Framework and then Common.On the left-hand side panel, edit the ORBServerPort parameter.
Click Validate Configuration.
Click Commit to Host.
Restart the component manager to implement the change. For procedure details, refer to "Starting IP Service Activator Components".
When a transaction fails, helpful fault information is provided in Service_Activator_Home/DebugLogs/System_Logger.log.
You can review fault messages in the ReasonForFailure attribute for the failed transaction by way of the integration manager CLI. (Log into the CLI and put the failed transaction into context.) For more information, refer to the IP Service Activator OSS Integration Manager Guide.
In IP Service Activator, you can view the configuration running on a device. For an in-depth analysis of the configuration, you can perform a device audit or a per-service audit. Note that performing an audit is an administrator function.
The audit feature identifies discrepancies between an IP Service Activator configuration and the corresponding configuration currently on the device.
To view the configuration currently running on a device, you can use the snapshot option, as follows:
auditdevice -snapshot -all | <IP_address_of_device> | <device_name_in_object_model>
Examples:
auditdevice -snapshot -all OR auditdevice -snapshot 10.13.4.115
The snapshot option audits the router and creates text file (ip_address.txt) that contains the router configuration and places it in the directory named "SnapShotDir". This option is used for internal purposes. In addition, the tftp server picks up the snapshot text file from the SnapShotDir directory.
This section describes how to perform a command-line version of the device audit, where the report is stored, and how to read the report.
You can also perform a device audit on a cartridge-managed device from the Device properties - Audit/Migrate page in the GUI. Results are displayed in the GUI, but not stored. For details, refer to the Online Help procedure for running a device audit. The Device properties - Audit/Migrate page is not displayed for devices assigned to a proxy agent with device drivers.
To perform a device audit from the server:
Telnet to the machine currently running the Network Processor and execute the following command:
auditdevice <IP address of device> | <device name in object model>
For example:
auditdevice 10.13.4.115 OR auditdevice rot10008-1
The completed audit file appears in Service_Activator_Home/AuditTrails/reports. The audit file name format is audit.IP address of device.date-time.xml.
To view a device audit report, open the audit XML file in a web browser; the appropriate stylesheet automatically loads. The stylesheets reside in Service_Activator_Home/AuditTrails/reports. A Juniper device audit uses the stylesheet juniperXMLDeviceAudit.xsl. All other device audits use the stylesheet deviceaudit.xsl.
If you cannot access the directory Service_Activator_Home/AuditTrails/reports directly from your web browser, you must copy the xsl and audit xml files to your local machine to view the reports.
Analyze the reports to see if there are any configuration discrepancies that need to be corrected. See "Audit File Color Coding".
The following are examples of audit reports for Cisco and Juniper devices:
Audit report for 10.13.4.115 (cisco, rot10008-1)
ip route 38.1.1.0 255.255.255.0 Serial2/0/1.1/3/1/1:1.21

interface Serial2/0/1.1/3/1/1:1.21 point-to-point
description test
bandwidth 128
ip address 41.6.1.1 255.255.255.248
frame-relay interface-dlci 21
Audit Report for 10.13.4.157 (JuniperXML, rotm10-5)
interfaces {
so-0/1/0 {
clocking internal;
###ACTUAL VALUE ON DEVICE: frame-relay-ccc ###
encapsulation frame-relay;
unit 18{
disable ;
description test;
bandwidth 128;
point-to-point ;
inverse-arp ;
dlci 18;
family {
inet {
address 77.0.0.1/30{
primary ;
}
}
}
}
}

}
routing-options {
static {
route 10.0.0.0/8{
next-hop 10.13.4.1;
}
}
}
You can perform an audit on an individual service of a device, without running a full device audit.
To perform a service audit:
Retrieve the external IDs of the concretes for the services you want to audit:
Log in to the OSS Integration Manager command line interface.
Run the command:
find <device ID> concreteobject:"*"
Run the following command and look for the external ID value:
cat <concrete ID>
Repeat as necessary to retrieve all external IDs of the concretes involved in the service.
Telnet to the host currently running the Network Processor and run the following command:
auditdevice -filter <external ID of concrete> <IP address of device>
For example:
auditdevice -filter 26890 10.13.4.115
For the value <external ID of concrete>, you can list multiple values, separated by commas.
The completed audit file appears in Service_Activator_Home/AuditTrails/reports. The audit file name format is audit.<IP address of device>.<date-time>.xml.
To view a device audit report, open the audit xml file in a web browser; the appropriate stylesheet automatically loads. The stylesheets reside in Service_Activator_Home/AuditTrails/reports. A Juniper device audit uses the stylesheet juniperXMLDeviceAudit.xsl. All other device audits use the stylesheet deviceaudit.xsl.
If you cannot access the directory Service_Activator_Home/AuditTrails/reports directly from your web browser, you must copy the XSL and audit XML files to your local machine to view the reports.
Analyze the reports to see if there are any configuration discrepancies that need to be corrected. See the topic "Audit File Color Coding".
When blue text appears in the audit report, it indicates that conflicting configuration exists on the device. This is usually due to configuration added manually, unknown to IP Service Activator. You can control whether to display or hide manual configuration in the audit report for a service audit. By default, the manual configuration is not displayed in the audit report.
To display the manual configuration associated with a service, add or modify the following attribute in the default.properties file:
suppressManualConfigInPerServiceAudit = false
When set to false, any manual configuration will be displayed in the Per Service Audit report.
To suppress reporting the manual configuration associated with a service, set the value of the attribute to true.
Note:
When a per-service audit is initiated with the suppressAuditFeedback property in the networkprocessor default.properties file set to false; the concrete audit states, and device audit state will be updated as in a full audit of the device. The generated per-service audit report is filtered using the IDs in the filter list.The audit file displays text in different colors to indicate whether configuration discrepancies have been found. Table 6-13 displays the definitions of the audit file color coding when displayed in a browser using the style sheet.
Table 6-13 Audit File Color Coding
| Status of the command line in the audit file | Command Re-issue View | Audit View |
|---|---|---|
|
NORMAL: No discrepancies exist between the device and the IP Service Activator device model. |
Black |
Black |
|
MISSING: Configuration command delivered by IP Service Activator is missing from the device. |
Red |
Red: Bold & Italic |
|
CHANGED: The configuration is changed. The value that IP Service Activator configured on the device and the actual value now on the device are both displayed in red. |
not applicable |
Red: bold & italic |
|
CONFLICT: Conflicting configuration exists on the device. It may be due to manual configuration, or commands that are in the wrong sequence, or other cause. |
Blue |
Blue: italic |
|
POTENTIAL: Some commands may be marked as undisplayable in the Audit template XML file, even though they were sent by IP Service Activator. |
Purple |
Black: bold & italic |
|
UNMANAGED |
not applicable |
Gray |
|
WRONG ORDER: The command order in IP Service Activator is different from the command order on the device. |
not applicable |
Black with Yellow background |
Note about CTM-generated configuration: Configuration Template Module commands are not audited by IP Service Activator. IP Service Activator device audits may display these commands as manual configuration, as if they were provisioned outside of IP Service Activator. As such, they may appear in blue (conflict) text in the audit reports.
Audit synonyms can improve the success rate of a device audit, for devices that display commands differently from IP Service Activator.
The audit compares IP Service Activator commands to the commands displayed on the device. If the two sets of commands match, the audit passes. If the two sets of commands have discrepancies, the audit fails.
Some device and OS combinations display commands in a slightly differently format than IP Service Activator. This causes the audit to fail even though the commands are equivalent. In this case, you can specify synonyms for these commands. The use of audit synonyms applies regular expression "match and replace" (substitute) directives that allow the audit comparison to determine if two commands are equivalent. Synonyms do not appear in the audit results; they are only used at the time of comparison to see if two commands are equivalent. You can apply synonyms to the IP Service Activator-expected commands, or to the commands displayed on the device, or to both.
Each command can have only one synonym made up of one or more match and replace criteria. Each synonym can match only one command within the scope of a single audit template.
System synonyms are delivered with the product software. However, you can redefine system synonyms or create new synonyms.
When the network processor starts, it loads synonym files from two locations:
System synonyms are loaded from the file synonyms.xml located in the cartridge.
Custom synonyms are loaded from valid synonyms files in the directory:
Service_Activator_Home/Config/networkProcessor/Custom/AuditSynonyms
A valid synonyms file is one that conforms to the synonyms schema; its filename is not relevant.
Map folders in the synonym files are keyed by the audit template.
Maps in the synonyms files are keyed by the id. Any maps loaded later that have the same key will replace existing maps.
Note that maps for all cartridges are loaded into the same namespace. This allows maps to be shared. However, if you do not want to share a map, then you must name it uniquely so it does not unintentionally overwrite a previously loaded map.
<?xml version="1.0" encoding="UTF-8"?>
<synonyms xmlns:xsi="http://www.w3.org/2001/XMLSchema-instance"
    xsi:schemaLocation="http://www.metasolv.com/serviceactivator/synonyms synonyms.xsd"
    xmlns="http://www.metasolv.com/serviceactivator/synonyms">
    <mapFolder>
        <auditTemplate>file://com/metasolv/serviceactivator/cartridges/cisco/units/cu1/auditTemplate.xml</auditTemplate>
        <mapGroup>
            <cmdRef>cisco.interface.rate-limit</cmdRef>
            <mapRef>set-mpls-exp-imposition-transmitNormalizer</mapRef>
        </mapGroup>
    </mapFolder>
    <map>
        <id>set-mpls-exp-imposition-transmitNormalizer</id>
        <mapCurrent>
            <match>(set-mpls-exp-imposition-transmit)</match>
            <replace>set-mpls-exp-transmit</replace>
        </mapCurrent>
    </map>
</synonyms>
This section describes the elements in a synonyms file. For an example, see "Sample Synonyms File".
<mapFolder>: The map folder consists of an audit template URL and a number of map groups. You can have multiple map folder entries within a synonyms file to organize your synonyms for reuse across multiple cartridge units.
<auditTemplate>: The map folder points to the URL of an audit template file which lists all commands applicable to a specific cartridge unit.
<mapGroup>: Each map group consists of a command reference and a map reference that apply to one synonym. The synonym is applicable when the specified audit template file is in scope for the executing cartridge unit.
<cmdRef>: The command reference value is the <commandID> defined in the audit template file for the command. It is the first indication during runtime that a synonym exists for the command.
<mapRef>: The map reference value is a pointer to the associated map ID listed later in this synonyms file, where the synonym match/replace code is defined.
Note: <mapRef> can reference map elements in any of the currently loaded synonym files. This is useful when referencing maps in the system synonyms file, but may have undesirable effects if referencing maps defined to be used with other audit templates. Prevent this problem by carefully defining command IDs. (See "Creating a Custom Synonyms File".)
<map>: The map is the basic synonym element, and consists of:
<id>: identifies the map pointed to by the map reference <mapRef> in the Map folder.
<mapCurrent>: matches the command format configured on the device and specifies the replacement command format.
<mapExpected>: matches the activation command format sent to the device by IP Service Activator and specifies the replacement command format.
You can have multiple <mapCurrent> and <mapExpected> entries within a map to produce the resulting synonym.
When system synonyms need modification or enhancement, you can modify entries (on a per-command basis) in the custom synonyms file, located in the following directory:
Service_Activator_Home/Config/networkProcessor/Custom/AuditSynonyms
If one does not already exist, you can create a custom synonyms file from a copy of the system synonyms file located in the sample registry directory for each cartridge. For example, for the Cisco cartridge, go to:
Service_Activator_Home/Config/networkProcessor/ciscoSampleRegistry
To define synonyms for a command, start by defining a <mapFolder> that references the appropriate audit template. Next, define within it a custom <mapGroup> element with a <cmdRef> that references the command ID. Next, define the <map> element. Then add a map reference for the map element.
The custom <mapGroup> must reference all applicable <map> elements to produce the correct synonym for a command. In addition to adding a new map for a command in the custom synonyms file, if a map exists for the command in the system synonyms file and it still applies, you must add a <mapRef> in the custom <mapGroup> to reference the corresponding <map> element in the system synonyms file.
There are two synonym tools available: auditSynonym and npAdmin.
You can use the auditSynonym tool to help you develop synonyms. It uses the perl5 regex engine.
UNIX: bin/auditsynonyms <regex> <substitution> <input>
Windows: Program\auditsynonyms.bat <regex> <substitution> <input>
> Program\auditsynonyms.bat ”(black)” ”red” ”any value black”
Output:
Regex:  (black)
Subst:  red
Input:  any value black
Output Perl5: any value red
Regex:  (threshold-type (?:(?:never)?(?:immediate)?(?:average [0-9]*)?(?:consecutive [0-9]*)?)(?:xofy [0-9]+ [0-9]+)?) (threshold-falling [0-9]+) (action-type (?:trapOnly)*(?:trapAndNvmt)*)?
Subst:  $3 $1 $2
Input:  rtr reaction-configuration react Timeout threshold-type average 11 threshold-falling 2 action-type trapAndNvmt
Output Perl5: rtr reaction-configuration react Timeout action-type trapAndNvmt threshold-type average 11 threshold-falling 2
You can use the npAdmin tool to force the network processor to reload both the synonyms and audit template files:
npAdmin.sh reload_synonyms
You can also use the npAdmin tool to display the current synonyms in effect on a network processor:
npAdmin.sh display_synonyms
Audit templates define filter patterns to be applied to commands to identify configuration of interest, and to affect their inclusion in the audit report. Audit templates also set attributes on the command results, which, when viewed using a stylesheet, affect how they are displayed to the IP Service Activator user.
The auditTemplate.xml file is located in the sample registry directory for each cartridge. For example, for the Cisco cartridge, go to:
Service_Activator_Home/Config/networkProcessor/ciscoSampleRegistry
Audit templates for base cartridges have two command sets. Audit templates for service cartridges have only one command set, the one described as 2nd command set.
For a service cartridge, the 1st command set is not needed; the 1st command set from the base cartridge's audit template file describes the commands that the network processor must issue to the device to retrieve the entire configuration of the device for the base cartridge, and all of the service cartridges that extend the services of the base cartridge.
1st command set: the device commands to list a device's entire configuration
2nd command set: a complete set of the commands that the cartridge is capable of sending to the device
The following is an example of the structure of an audit template (auditTemplate.xml) file:
<commandSession
xmlns="http://www.metasolv.com/serviceactivator/climodel"
xmlns:xsi="http://www.w3.org/2001/XMLSchema-instance">
   <command>
      <!--commands to show configuration-->
      <commandId>show-commands</commandId>
      <commandString/>
      <command kind="show">
         <commandId>show-commands.show_running-config</commandId>
         <commandString>show running-config</commandString>
      </command>
      <command>
         <commandId>show-commands.logout</commandId>
         <commandString>logout</commandString>
      </command>
   </command>
   <command>
      <!--context specific filter patterns toidentify configuration of interest-->
      <commandId>cisco</commandId>
      <commandString/>
      <command>
         <commandId>cisco.interface</commandId>
         <commandString>îinterface</commandString>
         <command>
            <commandId>cisco.interface.description</commandId>
            <commandString>îdescription .*$</commandString>
         </command>
         <command>
            <commandId>cisco.interface.ip_address</commandId>
            <commandString>î(no\s)?ip address</commandString>
         </command>
      </command>
      <!--Alias command for configuration version -->
      <command configVersion="true"reportManualConfig="true">
         <commandId>cisco.alias_IpsaConfigVersion</commandId>
         <commandString>îalias exec IpsaConfigVersion \S+</commandString>
      </command>
   </command>
</commandSession>
When an audit is requested for the device, the network processor sends the first command set to the device to retrieve its configuration, which is filtered against the commands in the second command set. Commands that match those configured by the cartridge (that is, those listed in the second command set) are converted into a CLI document.
The network processor then invokes the annotated device model to CLI transform from the cartridge on the last pushed (or persisted) device model (which matches the IP Service Activator internal representation of what is configured on the device).
A comparison is made between the two CLI documents. This comparison can highlight discrepancies including:
commands sent to the device that are now missing
commands added to the device that are not in the network processor device model (manually configured outside IP Service Activator)
commands that are in the wrong order on the device. (In some cases command ordering affects how the device works.)
The audit template referenced by each cartridge unit, and by each synonyms file, lists all commands that can be applied by the cartridge.
Each command has a <commandString> and an associated <commandId>. The command ID can imply its command string, but should use a hierarchical structure, as in the example.
A <commandId> is an identifier that tells IP Service Activator that the command has a synonym.
A <commandId> must be unique within an audit template. The same <commandId> can be used for the same command in different audit templates that reuse the same synonym.
Each unique version (format) of a command string should have a unique command ID. For example, the <commandId> should be different in different audit templates when the same command requires a different synonym (because of OS display differences).
The <commandString> is the actual text of the command. Commands and their parameters can be hierarchically defined in the Audit template, as shown in the previous sample.
Audit template attributes are used to accommodate variations in device responses and to customize the audit report. You can apply these attributes to each individual <command> element to tell the audit to treat this command in a particular manner.
For example, when you read device configuration, the device could:
display a command in lower case where IP Service Activator provisioned the device in upper case
display commands indented incorrectly (resulting in wrong context interpretation)
Attributes can be used to ensure the expected command format is displayed in the audit report.
You can use attributes to indicate that specific commands need to follow one another in a particular order.
Attributes
kind=<string>
configVersion=<boolean>
ordered=<string>
autoIndentUtil=<string>
ignoreCase=<string>
reportManualConfig=<boolean>
brokenIndentRulesOffset=<int>
The kind attribute affects how the command is used to match commands on the device. Table 6-14 lists the effect of the kind attribute value:
Table 6-14 Using Kind Attribute Values
| Kind Attribute Value | Attribute Value Effect |
|---|---|
|
ALWAYSIGNORE |
Excludescommand from the audit report when found in any context. |
|
IGNORE |
Excludes command from the audit report when found in this context. |
|
IGNORE_CASE |
Performs a case insensitive comparison with command on device. |
|
IGNORE_CHARS |
Performs a comparison with commands on device ignoring characters that follow the attribute (e.g. <command kind=”IGNORE_CHARS -”>. A dash (-) appears in the device configuration, however, you want the audit to ignore it. |
|
CHECK_DEFAULT |
Performs a comparison with commands on the device marking missing commands as ”potentially” missing. This is used for special handling in cases where devices do not display default values in a command string. |
|
PARTIAL |
Performs a comparison with commands on the device taking the command element name (as depicted in the audit template) as part of the full command. This allows the audit to determine equality between IP Service Activator provisioned commands and those seen on the device using a partial comparison only. |
The audit template command kind attribute affects the inclusion of the command, and its kind attribute value in the resulting audit report. Table 6-15 shows the effect of the kind attribute on the resulting audit report:
Table 6-15 Effect of Kind Attribute on Audit Report
| Cmd in IP Service Activator | Cmd on Device | Command in Audit Template | "Kind" in Resulting Audit ReportshowAll=false (IPSA) | "Kind" in Resulting Audit ReportshowAll=true (CM) |
|---|---|---|---|---|
|
C1 |
C1 |
Present |
NORMAL |
|
|
C1 |
C1 |
Present + kind=CHECK_DEFAULT |
NORMAL |
|
|
C1 |
C1 |
Present + kind=IGNORE |
exclude |
UNMANAGED |
|
C1 |
C1 |
Not Present |
exclude |
NORMAL |
|
C1 |
C1' |
Present | Present + kind=PARTIAL |
CHANGED |
CHANGED (Missing:Conflict) |
|
C1 |
C1' |
Present + kind=PARTIAL_DISPLAY_ALL |
MISSING |
CHANGED (Missing:Conflict) |
|
C1 |
C1' |
Present + kind="CHECK_DEFAULT" |
CHANGED |
CHANGED (Potential:Conflict) |
|
C1 |
C1' |
Present + kind="IGNORE" |
exclude |
UNMANAGED |
|
C1 |
C1' |
Not Present |
exclude |
CHANGED (Missing:Unmanaged) |
|
C1 |
missing |
Present |
MISSING |
|
|
C1 |
missing |
Present + kind="CHECK_DEFAULT" |
POTENTIAL |
|
|
C1 |
missing |
Present + kind="IGNORE" |
exclude |
exclude |
|
C1 |
missing |
Not Present |
exclude |
MISSING |
|
-- |
C1 |
Present |
CONFLICT |
|
|
-- |
C1 |
Present + kind="CHECK_DEFAULT" |
POTENTIAL |
|
|
-- |
C1 |
Present + kind="IGNORE" |
exclude |
UNMANAGED |
|
-- |
C1 |
Not Present |
exclude |
UNMANAGED |
Notes:
C1' means the command is the same, but some of its arguments are different.
CHANGED is a JuniperXML only tag. For others, this appears as a MISSING:CONFLICT pair.
Set configVersion to true on the command that sets the IP Service Activator configuration version. The IP Service Activator configuration version is a timestamp of when the configuration was last modified by IP Service Activator.
The ordered attribute lets you control whether or not the sequencing of commands is relevant when determining if discrepancies exist between the device and the IP Service Activator device model. Define a string value and set the ordered attribute value to the same string value for all commands at the same nesting level for which the sequencing is relevant. The correct sequence of the commands is the order in which they appear in the audit template.
Example
To specify that if commands "cmd B", and "cmd D" both appear under "cmd X", then "cmd D" must appear after "cmd B", set ordered="OrderBD" for both "cmd B", and "cmd D".
In this case, no discrepancies are found, because B and D appear in the correct sequence relative to each other:
cmd X
cmd A
cmd B
cmd C
cmd D
cmd E
In this case, discrepancies will be found since B, and D do not appear in the correct sequence relative to each other:
cmd X
cmd D
cmd A
cmd B
cmd C
cmd E
This attribute reports to the audit that every cmd under the current cmd is a child cmd until "<string>" is detected; after that, the context of the current cmd is exited. Use this command to deal with bad indenting.
Example
autoIndentUntil="cmd D"
cmd A
cmd B
cmd C
cmd D
cmd B, C, D are support be children of cmd A
The reportManualConfig attribute lets you control whether a command is reported as a manual configuration. By default, global commands are not reported as manual configurations, but nested commands are.
Reports to the audit that this cmd has a bad indent and that it should be corrected to absolute value X. This attribute deals with bad indenting and comes into play when CLIParser breaks out of context.
Example
for cmd D
brokenIndentRulesOffset="2"
cmd A
cmd B
cmd C
cmd D
cmd E
In this example, cmd D is supposed to be a child of cmd A, however its relative position shows it is out of context for cmd A. The brokenIndentRulesOffset attribute is used when audit interrogates cmd D and is about break out of cmd A context, the absolute position of cmd D is then reset to ensure that cmd D is a child of cmd A or peer to cmd C, E, and so on.
|
Copyright © 2011, 2013, Oracle and/or its affiliates. All rights reserved. Legal Notices |
|