| Oracle® Enterprise Data Quality for Product Data Governance Studio Reference Guide Release 11g R1 (11.1.1.6) Part Number E29131-02 |
|
|
PDF · Mobi · ePub |
| Oracle® Enterprise Data Quality for Product Data Governance Studio Reference Guide Release 11g R1 (11.1.1.6) Part Number E29131-02 |
|
|
PDF · Mobi · ePub |
This chapter explains how to use the Output tabs created by your DSA so that you can review your data.
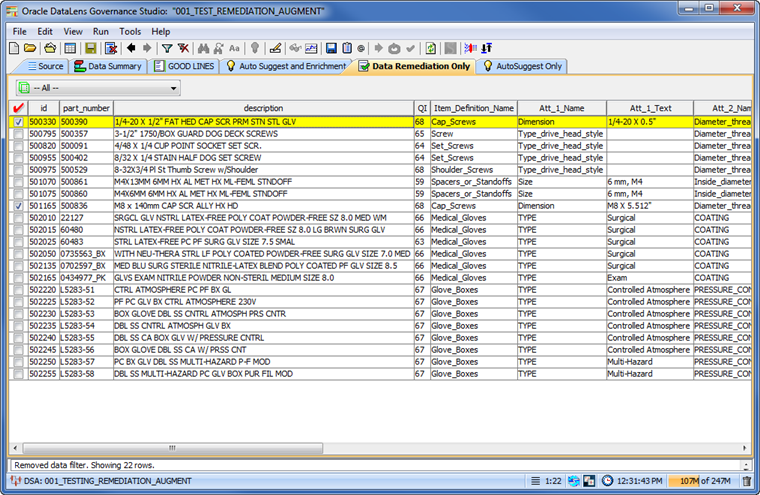
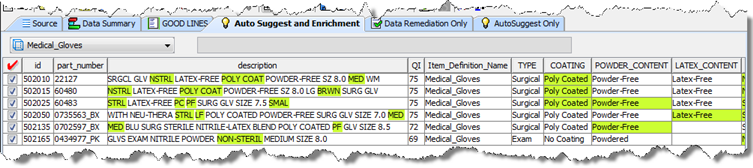
The "Data Remediation" Output tabs are identified by the green check mark icons on the tab. These types of tabs contain tables of output data and correspond to a DSA output step with the output type of 'Data Remediation'. Data in these tabs may be selected for output to a file, edited, emailed to others, or run as input to a synchronous job. The following figure shows an example of a 'Data Remediation' Output tab.
The following sections describe how to use Output tabs.
You can select a single row or multiple rows for additional processing using the following methods:
Use Ctrl+a.
Press and hold Ctrl and select the check box of each row you want to process.
Press and hold Shift then select the check box of the first row, and then select the check box of the last row in the group of adjacent rows that you want to process.
You may right-click on any row in a Governance Studio table and copy the data in the cell that you are hovered over to the clipboard. Data that has been copied into the clipboard may then be pasted into another application or into a different Output tab table in the Governance Studio.
For more information about context-sensitive menus in task panes, see "Top Pane Functions".
You can review and add new values for an attribute based on knowledge acquired from all of the data lenses defined in the Item Definition in your DSA. On any Output tab, you can by double-clicking in a cell for any attribute.
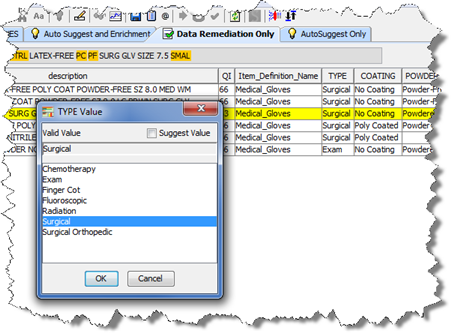
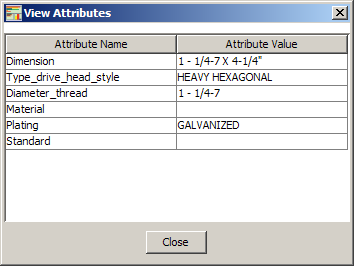
The resulting Attribute Value dialog box displays all of the valid values for the selected attribute; the attribute name is in the title of the dialog box. This list of valid values are retrieved from the corresponding data lens associated with the Item Definition of the item being remediated.
You can change the term in the selected cell by double-clicking on one of the valid values. Using the preceding example, you could change the term 'Surgical' to 'Chemotherapy' just by double-clicking on it.
If the attribute is based on attribute rules that parse based on Regular Expressions or are parsing Units Of Measure, the list of values is not be returned. However, you can manually add the missing values using the Attribute Value dialog box by right clicking on an empty cell, entering a value manually, and then clicking OK. The cell is updated with the new value.
You can enter your own values into an empty cell for consideration in your data enrichment task though these values are not importable. These value suggestions are made using the Attribute Value dialog box by double-clicking on a cell, select the Suggest Value check box, entering the value and clicking OK.
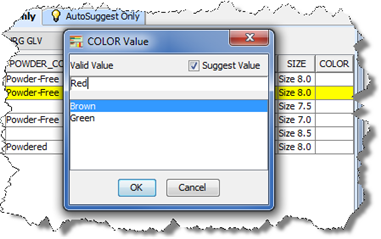
The cell is then updated with the new value. In this example, 'Red' is a new suggestion for valid parsing though since it is not associated with any of the valid values shown it is not automatically importable into your data lens. When imported into Knowledge Studio, it is displayed as a suggestion for your review for the 'COLOR' attribute.
Another type of a suggestion that is not importable is a non variant based suggestion for a new valid value for an attribute. In this example, 'COLOR' does not have 'No Color' as a color in the list of valid values so without basing it on a variant form in the data you would be suggesting that it should be a valid value of this attribute.
For a suggestion to be importable, they must be uniformly formatted and have all the information that is required to import into the data lens and create new rules.
To create a suggested value:
Select an AutoSuggest or data remediation tab.
Select a line of data.
The unrecognized text in the line of data is highlighted in the text box adjacent to the Item Definition list box.
Select the unrecognized text from the text box as in the following example:
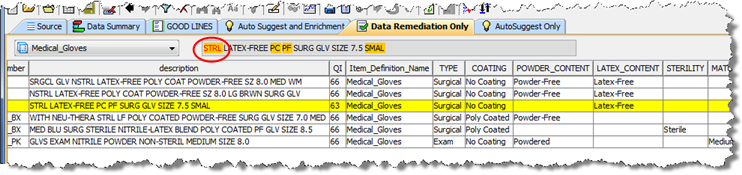
Click and drag the highlighted text to a blank cell in the attribute column that you want to add the variant to; your cursor becomes an arrow when the action is allowed.
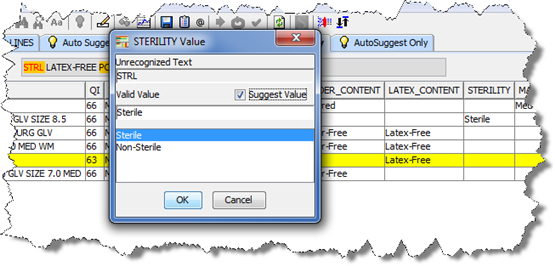
In this example, 'STRL' was highlighted in the text in the text box and drug to the STERILTY attribute field for that line of data. The STERILTY Value dialog appears with the dragged variant text in the Unrecognized text field. The closest valid value that should be associated with this variant text is selected ('Sterile' in this case) though you could change it by selecting one of the other valid values. This type of user suggestion is similar to the suggestions from AutoSuggest.
(Optional) You can click the Suggest Value check box and edit the Valid Value text box to create a user suggestion. This type of suggestion is generally not well formed so it is not importable into your data lens though it can follow through the enrichment process so that you can manually update your data lens.
Click OK to complete the addition of the valid value.
The ”Data Remediation with AutoSuggest" tab output is identified by the light bulb icon. Data in these tabs may access the Governance Studio AutoSuggest feature; this feature automatically predicts attributes that may have been missed due to misspellings and abbreviations or missing grammar. When this tab is not empty and there are suggested values for missing attributes available, the light bulb button is active. If no suggestions were found, this button is inactive (dimmed). The following figure shows an AutoSuggest table where the suggestion button is available.
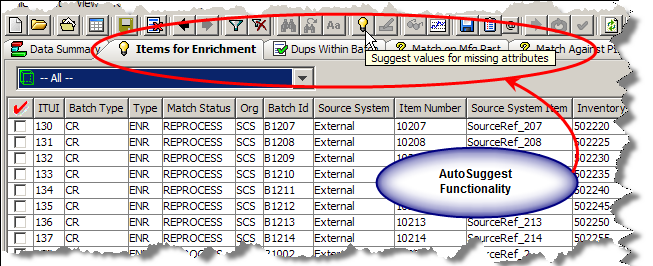
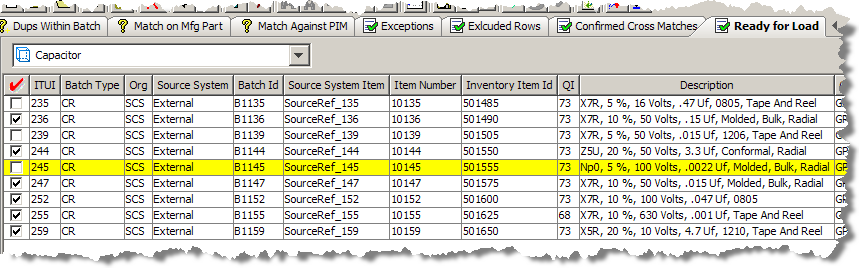
After clicking on an AutoSuggest Output tab, a table of data designated for output by the respective output step in the DSA is displayed. To view suggestions, click on the AutoSuggest light bulb button or from the Run menu, select AutoSuggest. Suggestions are now highlighted in green as shown in the following figure.
There are several operations that are allowed in the AutoSuggest table to process your data further and make it easier to edit, move, copy or accept suggestions. In addition to the normal table functions available to Output tab tables, the AutoSuggest table allows you to accept or reject suggestions, known as switching augmentations.
Right-clicking an attribute cell in a line (this is not applicable to the description) allows you to choose one of the two accept or reject suggestions.
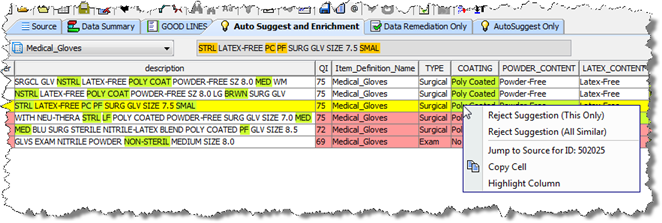
The suggestion options are used to toggle between accepted or rejected for the given cell. You can choose to switch the state of just the given cell with these options as follows:
Only the given line is switched.
All lines similar to the given line is switched. Similar suggestions are for the same data lens, item definition, and attribute with the same variant form of the full form.
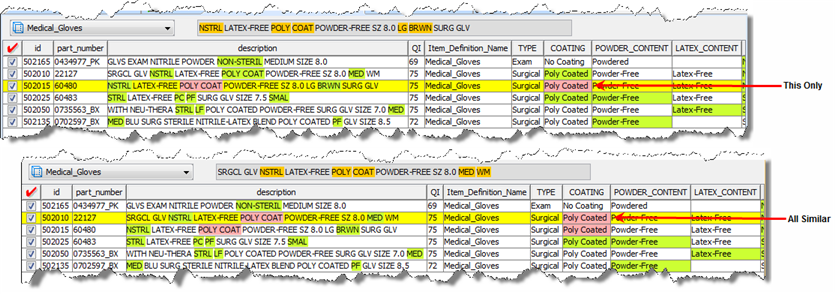
The following figure shows the results of the use of both Switch Augmentation options in the COATING column. The cells are now highlighted in pink showing that the attribute has been rejected; you can return the cell to accept by using the same option again.
When you have completed analyzing suggestions by rejecting the bad ones and keeping the good ones you can select the rows you want to complete the enrichment process by clicking the check box to the left of the row to select it. Once all of the rows you to be enriched are selected, click the Re-run button to send the checked rows to a secondary DSA process to complete the process. The checked rows move from the AutoSuggest tab if the enriched attributes and/or additions to the description increase the QI to the point where the row(s) no longer require enrichment.
Note:
While data enrichments are saved (both AutoSuggest and user suggestions), the AutoSuggestions themselves are not retained across sessions. In other words, after you reload a project, you no longer see the AutoSuggestion colorization and can no longer switch between accepting and rejecting them.You can create one or more tasks from all of the data enrichment suggestions (AutoSuggestions, User suggestions both importable and not importable) that you have effected in your project. You then import into your data lens (or all data lenses in a data lens group) in the Knowledge Studio to update its semantic knowledge thus completing the data enrichment process.
To create an enrichment task from any project tab:
Remediate your data using the data remediation techniques described in the preceding sections including adding valid values and AutoSuggest augmentation.
(Optional) On any AutoSuggest tab, approve or reject the AutoSuggest suggestions.
Click the Apply Enrichments button on the toolbar.
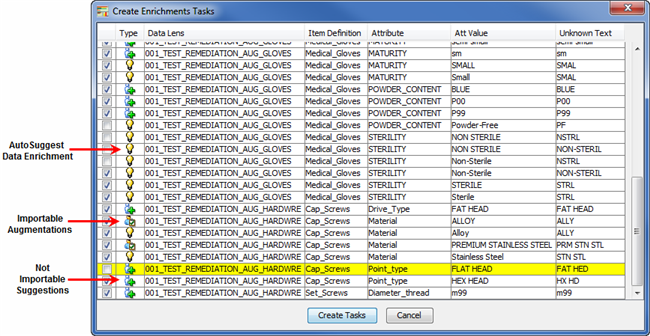
All of the available types of data enrichment are displayed including AutoSuggestions and both types of user suggestions, importable and not importable. Each of the three types is denoted with a different icon, as in the preceding example, so make identification easy. The default is that all enrichments are selected for task creation though this example shows that you can pick and choose items for enrichment.
You can deselect any of the data enrichments and they will not be included in the task.
Click Create Tasks.
The task is created with you assigned to it and the task number is displayed in the Status Field. The file that you can import into your data lens in the Knowledge Studio is stored on your Oracle DataLens Server.
You can view your enrichment tasks along with all of your other tasks, see "View My Tasks".
A matching application is a set of two DSAs that you use to find appropriate data records that match pre-specified criteria. A matching process is built upon a data lens (or set of data lenses), used to recognize items by their attributes and to rank attributes in order of importance.
Note:
The matching capability is an additional Enterprise DQ for Product component that is purchased and licensed. If match result Output tabs are expected though are not displayed, this functionality may not be activated. For more information, see Oracle Enterprise Data Quality for Product Data Oracle DataLens Server Administration Guide. To purchase this additional component, contact Oracle Sales.The output of the matching process is used in a DSA output step. There are two match result output types variations available for you to create in your DSA:
Single Selection Review, Approve, and Route
Multiple Selection Review, Approve and Route
If you have created a match results output step in your DSA, then the corresponding tab appears in your Governance Studio project. The following figure shows a project with a sample match result set.
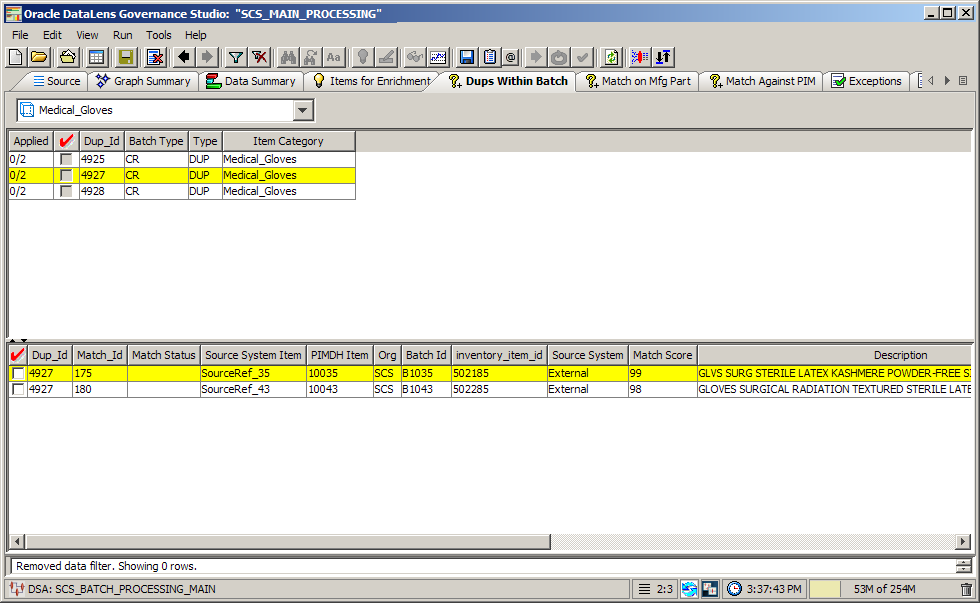
The Output tabs that contain data duplicates display a parent-child view of the match results. In a New Item Introduction use case, the system can match the new item against any existing items in your Item Master. The inbound row will be classified, its key attributes extracted and standardized, and a Semantic Key is created. This Semantic Key is used to find any potential duplicate rows in the Items Master. If matches for the incoming row are found in the item master, the system can route the row to a potential duplicates Output tab and give you a parent child view of the new record on the top pane, and the potential matches in the bottom pane.
The split screen function is only used for match result Output tabs. Once a row is selected from the top pane, the corresponding matched candidates for that row on the bottom pane are highlighted as in the following figure.
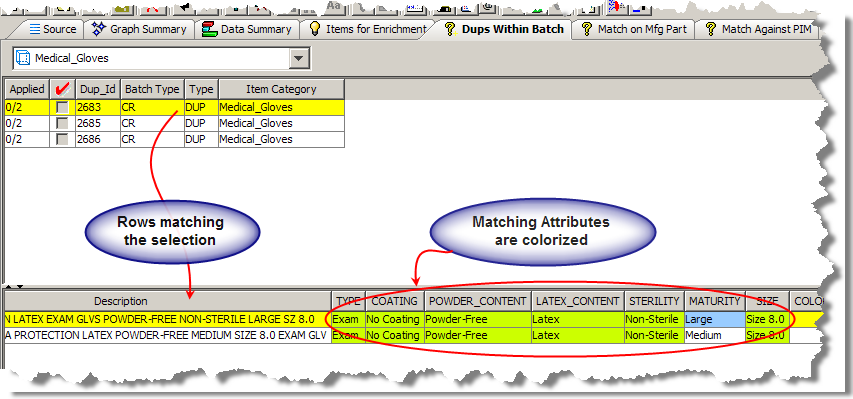
The Governance Studio output is color coded in order to highlight key attributes participating in the match. Additionally, the attributes are colorized based on the type of match rule that has been triggered on the attribute. Attributes are colorized as follows:
Match the parent row and were set to required in the item specific match rules.
Match the parent row and were set to participating, but not required in the item-specific match rules.
Indicates that the matched row did not contain a value for that particular attribute so that attribute did not participate in the match score.
Indicates that the matched row contains a value for that attribute, but that the attribute value for the matched row did not match the attribute value for the parent row.
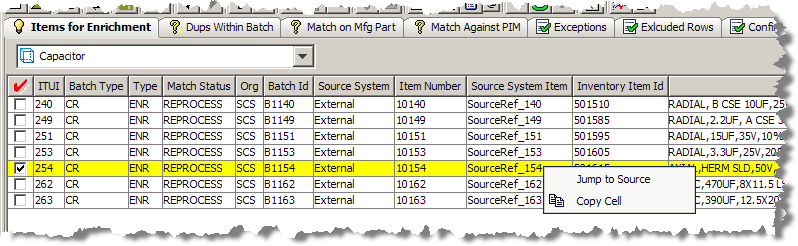
You can use the context-sensitive menu by right-clicking a data record and use the options as follows:
| Jump to Source
Activate the Source tab with the same selected output data selected. For example, this allows you to view the ID if it were not included in the output. |
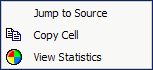 |
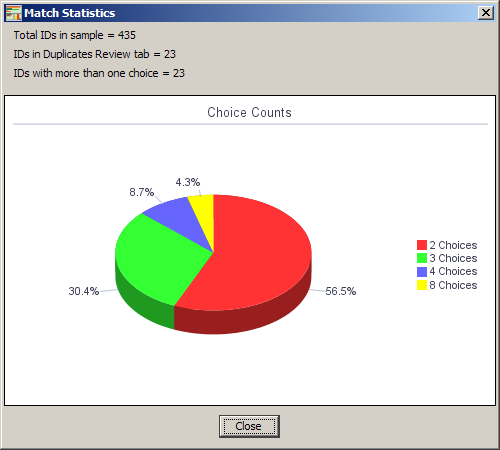
| Copy Cell
Copy the cell for downstream processing in a data lens or to another worksheet or file. View Statistics Displays number of choices per record; use this option for Match Process results to produce a graph of the breakout of rows with matching records as in the following figure: |
|
Similar to the top pane functionality, you can right-click on a matched row to use the following additional context-sensitive menu options.
| Filter
Allows you to filter the displayed data based on text or a text pattern. The filter operation applies only to the currently selected tab. Only the rows that match the text entered in the Filter dialog are displayed in the table. For more information about filtering, see "Filtering Data". Un-Filter Removes the filter applied to the selected tab so that all of the data is displayed. |
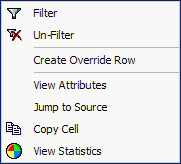 |
| Create Override Row
This functionality is detailed in the Survivorship Process section. View Attributes Provides a table view of the attributes for the selected row as in the following figure. |
|
The Governance Studio interprets a set of results and populates match results tabs based on:
the DSA option settings indicating a matched set, and
the accuracy of the attribute naming, order and structure.
You review the rows and determine the matching rows based on the defined use case as in the examples in the following sections.
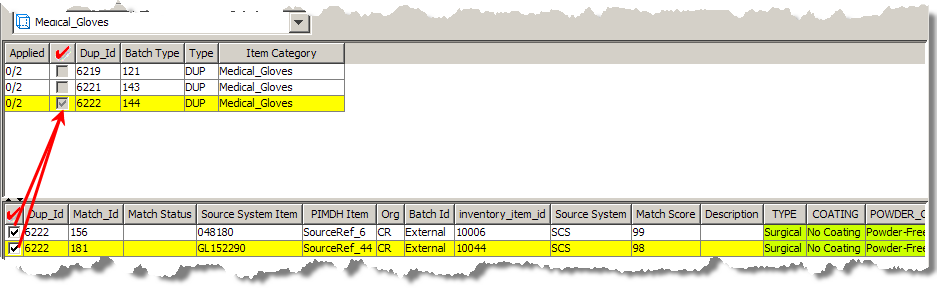
You select a single match item for each requested item to be quoted and the Governance Studio identifies the best record to for use in the quote based on the information in the data lens and other industry related criteria.
In the following figure, the selected Dup_Id is 6222 for which there are two items in the item master that can be quoted. To process the request for the quote process, you would select the best match based on the information provided by the system and possibly other criteria, such as the supplier or margin, and then select a single row to continue to be quoted. In this case, the Governance Studio determined that record 156 was the best quotable item for the Dup_Id 6222.

Once the record for quote has been selected, you can move the record to a downstream process using the options previously described.
A second popular use case is the creation of a functional equivalents cross-reference to be used by web-based merchandising applications. In this case, a cross reference of all the functional equivalents found in the item master by the Oracle DataLens Server corresponding to Dup_Id 6222 is created. In the following figure, Match_Id 156 and 181 are selected as the two functional equivalent records for record 12.
Once a record has been selected, you can process the checked rows with the options previously described.
The Dup_Id/Match_Id relationship can be used as a cross-reference, and by a down stream process, such as a PIM to create the cross-reference.
This advanced option assists in an item survivorship process by creating an override row that can then be manipulated to create a blended record of all possible duplicates. This is used during a system consolidation process.
Begin creating an override row by selecting a duplicates tab.
In the upper-pane, locate a duplicate to be merged and click the adjacent check box.
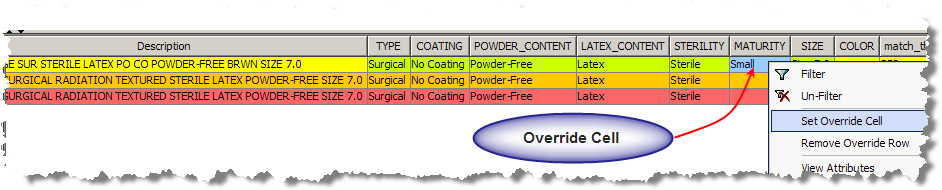
In the lower-pane, right-click on the duplicate row you want to merge and select Create Override Row.
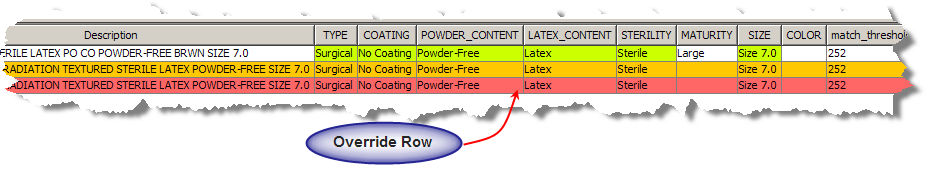
The selected override row is highlighted in orange and is indicated in the Match Status column by MO (manual override). Once an override row is selected, you can set an override cell from the context-sensitive menu or remove the override row selection.
In the following example, the third row has been selected as the override row, and the contents of the Maturity column (attribute) in the first row has been selected as an override cell.
The resulting blended record contains all the information from the override row with the exception of the size attribute, which is extracted from the override cells. You can select an unlimited number of override cells to create the blended record. Once the rules for the composite record have been created, the rows are selected.
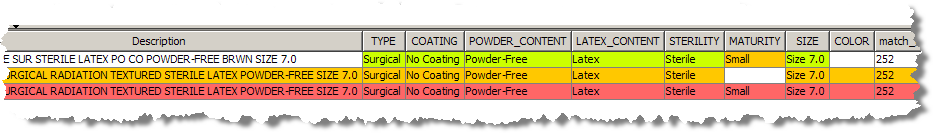
All of the additional options create a new row for the blended record tagged with an MO for Manual Override in the matched Match Status field. This informs the downstream survivorship process that this row is the override, which contains the blended record information.
Tip:
You can use a regular expression to filter your data to make it easier to work with a subset of the data and find the row that you want to use as the override row. For example, if your data contains an ellipsis (…) then you could filter your data using this as part of the regular expression with the text you are searching for, such as '…abc'. The filtered results would return only those rows that meet that condition. As a result, only checked rows of the filtered data are processed rather than the entire set so that you can easily create your override row. You first must remove the filter to remove the override row from the set of data. For more information about filtering, see "Filtering Data".Trend analysis is a Governance Studio feature that allows you to see a graph of the output data row count for various job runs you have made over time for a given output step. You can use this feature on any tab by clicking the Trend Analysis button or from the View menu, select Show Trend.
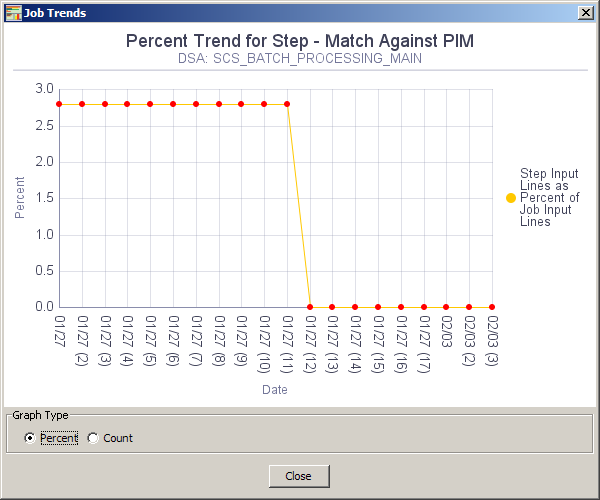
You can toggle the view of the graph as a percentage or count of the rows in the selected Output tab using the Graph Type options provided.
Though this functionality is available on all tabs, if trend data is not available, a message indicating this is displayed.
You can select one or more rows to create a task for another user to update the data lens. This capability is available on any Output tab.
From the Run menu, select Create Task from Checked Rows.
Note:
If the Output tab is a split-screen, you must choose whether you want to use total number of rows that include both the detail and total number of checked rows.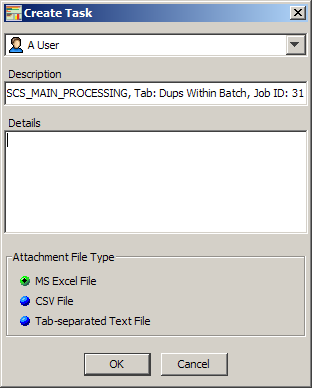
Select the user to whom this task will be assigned.
Edit the automatically populated Description field if you want. It is populated with the DSA name, Output tab that the task is being created from, and a unique Job ID for the task (though this is not recommended.)
Add all instructions for user so that the task can be accomplished in the Details field.
Select the type of file to contain the selected to attach to the task using the options.
Click OK.
The task is created and an email containing the task detail is sent to the assigned user. Attachments can be downloaded by the assigned user as described in the View My Tasks section.
You can see if you have any tasks, including enrichment tasks, assigned to you with this feature.
From the View menu, select View My Tasks.
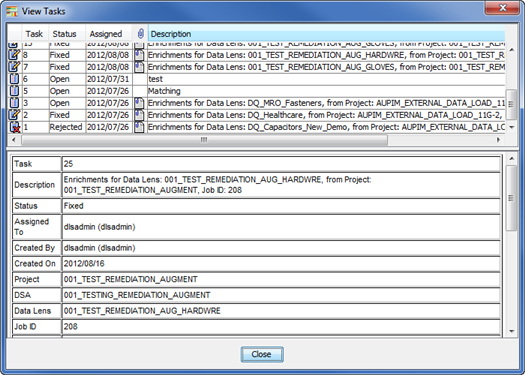
All assigned tasks are displayed in the top pane, while the bottom pane provides the details for the selected task. The information displayed by column left to right is:
Status icon representing the status.
Task number assigned to each task.
The status of the task, which can be changed, and corresponds to the status icon. A task can be Open, Fixed, Rejected, Closed, or Deleted.
The date the task was assigned to you.
An attachment for the task.
The description of the task.
Data enrichment tasks descriptions are automatically created identifying them as such with the data lenses that are effected and the DSA Job ID. For example, 'Enrichments for Data Lens: 001_TEST_REMEDIATION_AUG_GLOVES, from Project: 001_TEST_REMEDIATION_AUGMENT, Job ID: 132'. Right-clicking one of these tasks activates the View Enrichments option.
Note:
Though the fields in the bottom pane appear to be editable, the changes are not saved.The context-sensitive menu in the top pane is activated by right-clicking the attachment icon and is used as follows:
| Change Task Status | 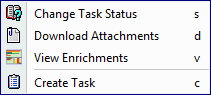 |
| Download Attachments
You can download the file that was saved when the task was created for use in completing the task. A file save dialog appears for you to select the directory in which to save the file. |
|
| View Enrichments
This option is active when the selected task is a data enrichment task. See "Viewing Data Enrichment Tasks". |
|
| Create Tasks
See "Creating a Task". |
|
From the View Task dialog, locate a data enrichment task (for example, 'Enrichments for Data Lens: 001_TEST_REMEDIATION_AUG_GLOVES, from Project: 001_TEST_REMEDIATION_AUGMENT, Job ID: 132'), right-click it and select View Enrichments.
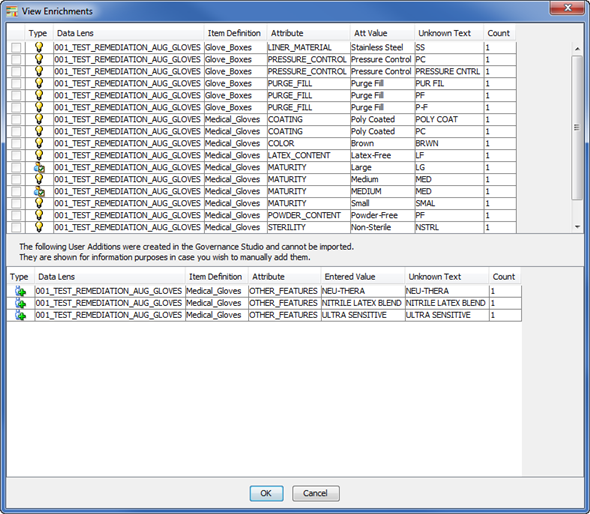
The View Enrichments dialog allows you to review the data enrichments that can be imported into the specified data lens by item definition, attribute, attribute value, and the new (unknown) term in the top pane. Any enrichments that are not importable are listed in the bottom pane so that you can review them and consider manually adding them to your data lens.
Selecting this option allows you to change the status of the task and/or reassign the task to another user.
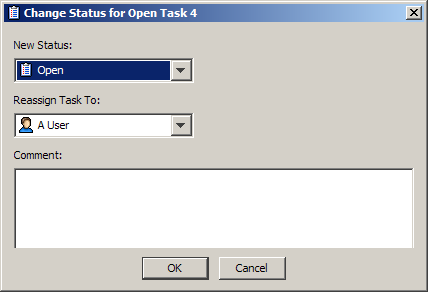
Select a new status and/or a user to reassign the task to from the lists.
Tip:
You can use the Unassigned Tasks user if you are unsure who you want to review this task and intend to assign it the proper person later.Enter a comment that reflects why you have affected the change for future reference or to alert the new recipient of the task and why they are now responsible for it.
Click OK.
Selecting this option allows you to create an entirely new review task.
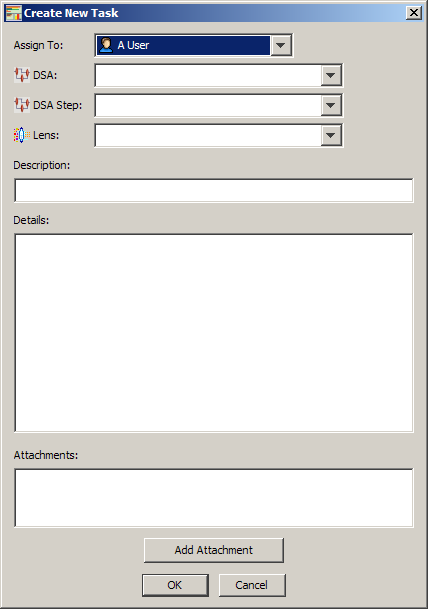
Select a user to complete this task.
Select the DSA and the DSA step that you want to change.
Select the data lens to which the change is to be applied.
Enter a description and specific instructions on how to perform the task.
If you have a data file or other information that you want to attach, click Add Attachment, locate the file, and then click OK.
Repeat this step until all necessary files are attached.
Click OK.
The task is created and an email containing the task details is sent to the assigned user.
The Statistical Similarity (StatSim) matching application is composed of two Data Service Applications (DSAs) that you use is used to quickly identify similar records in your data. StatSim is generally used when attempting to match a set of query records against an index of thousands or millions of records. Data lenses are not necessary for StatSim matching. Statsim is an implementation of a similarity metric that considers both the amount of shared and unshared content between two records. The relative frequencies of the character strings involved in the records being compared are also considered. Using this information, a similarity score is generated for each record used in the index, indicating the similarity between the query and index records thus the StatSim index is created. See Oracle Enterprise Data Quality for Product Data Application Studio Reference Guide.
After you have created and tested your StatSim DSAs, you create a Governance Studio project to process your data, identify matches, and perform remediation.
Create a new project ensuring that you select your StatSim match DSA and identify your query data. See "Creating and Running a Governance Studio Project".
(Optional) Click the Stat Match Options button on the toolbar to set the runtime options. Set the options as described in step "Changing Statistical Match Runtime Options", and then click OK.
Click the transform data button on the toolbar to obtain your match results.
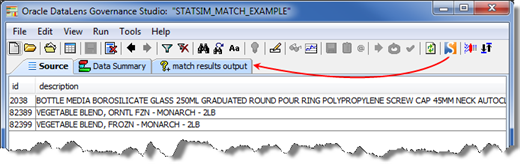
Click on your Match Results tab to view your results.
Click on a line of data to view the match results for it.
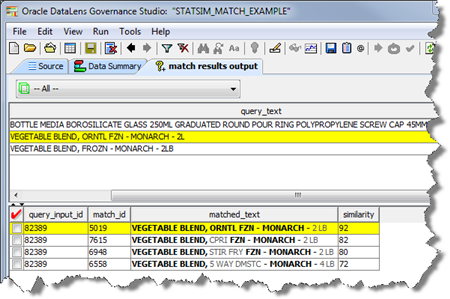
The query records are on the top pane and the matched index records are on the bottom pane.The match results are ordered, with the closest match being at the top of the list. The bold characters indicate precisely which characters match between the query record and the index record.If you do not wish to have the matched characters presented in bold, turn off the Save Highlighted Text StatSim match runtime option. See "Changing Statistical Match Runtime Options".
As with all Output tabs, you can use any of the functions including using the checked rows to create a task, filtering the results, or creating an override row.
The StatSim matching runtime options allow you to dynamically modify the result and match settings, as well as the fields to use in the match process. You can change these options to produce numerous matching variations using the same query and index.
Use the following steps to change these options:
From the Tools menu, select Statistical Match Options or click Stat Match Options button on the toolbar.
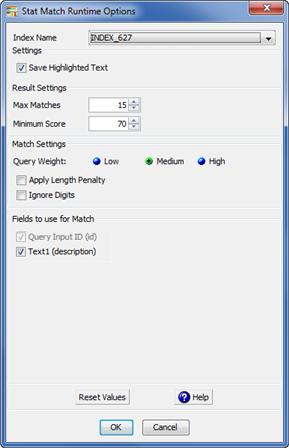
Select the name of the StatSim index you want to use from the Index Name list box. This list is populated based on the database connection you select.
Select Save Highlighted Text to highlight the matched characters in bold.
Select the Max Matches and Minimum Score values or use the recommended defaults from the respective list boxes to return match results that allow you to view a reasonable set of match results with the best matches at the top of the list.
Increasing Max Matches and/or decreasing Minimum Score will return more match results. Decreasing Max Matches and/or increasing Minimum Score will return fewer match results.
Select one of the Query Weight options. Medium is recommended for most datasets and applications because it considers both the shared and unshared content between the query and index records.
If the index records are short (10-60 characters) and your query records are consistently much longer, then select Low for your Query Weight.
If you wish to search for records (find the records in the index that contain the exact terms appearing in query records), then select High. This increases the number of match returns. This, however, will result in the returned items having additional unmatched words in the descriptions.
(Optional) Select the Apply Length Penalty check box to penalize very short matches. Experiment with checking this box if similar lines in your dataset have widely varying line lengths.
(Optional) Select the Ignore Digits check box to apply a rescoring of the original match results so that the digits in the query and index lines are ignored and similar scores are calculated based on the remaining text.
If you select Ignore Digits, the following pair of records will have a match score of 100:
Pencil, Automatic, .4mm, Blue Cap
Pencil, Automatic, .5mm, Blue Cap
Notice that these two lines differ only in their digits. When Ignore Digits is selected, the digits are ignored and the match score is calculated based on the remaining text.
Use the Fields to use for Match check boxes to indicate the number of description fields to use when processing the job; these check boxes reflect the input names for the selected StatSim matching index. Each record must have an ID, so the Query Input ID (input name) check box is selected by default.
Tip:
You can reset the values to those set in the StatSim matching DSA at any time by clicking Reset Values.Click OK.
|
Copyright © 2001, 2013, Oracle and/or its affiliates. All rights reserved. Legal Notices |
|