| Oracle® Communications Services Gatekeeper Platform Test Environment Guide Release 5.1 E37534-01 |
|
|
PDF · Mobi · ePub |
| Oracle® Communications Services Gatekeeper Platform Test Environment Guide Release 5.1 E37534-01 |
|
|
PDF · Mobi · ePub |
This chapter explains how to use the Platform Test Environment (PTE) graphical user interface to test an Oracle Communications Services Gatekeeper implementation. This GUI is the main access point for most PTE features. Any changes you make using the PTE are saved when you exit the program.
This chapter assumes that you have read "Understanding the Platform Test Environment" and understand the PTE configuration workflow.
This section explains how to install and start the PTE.
Before you use the PTE, you must first:
Install Services Gatekeeper. The PTE is automatically installed as part of Services Gatekeeper in the Middleware_Home/ocsg_pds_5.1/pte directory by default. For details on installing Services Gatekeeper, see “Installing Oracle Communications Services Gatekeeper” in Oracle Communications Services Gatekeeper Installation Guide, another document in this set.
Run the Middleware_Home/wlserver_10.3/server/bin/setWLSEnv script or set the equivalent path so that you have access to the PTE scripts in Middleware_home /ocsg_pds_5.1/pte.
To start the PTE on a Windows-based system do one of the following:
(GUI Mode) From your system Start menu, select All Programs, then Oracle Communications Services Gatekeeper 5.1.0.0, and Platform Test Environment.
(GUI Mode) Using a command window, change directory to Middleware_home /ocsg_pds_5.1/pte and type run.cmd.
(Console Mode) type console.cmd in a command window in the Middleware_home /ocsg_pds_5.1/pte directory. Console mode is usually only used for testing new or customized PTE extensions.
To start the PTE on a UNIX or Linux-based system do one of the following:
(GUI Mode) Using a command window, change directory to Middleware_home /ocsg_pds_5.1/pte and type run.sh.
(Console Mode) Using a command window, change directory to Middleware_home /ocsg_pds_5.1/pte and type console.sh. Console mode is usually only used for testing new or customized PTE extensions.
Note:
Settings compatibility between different versions of the PTE is not guaranteed.To configure and maintain your PTE Server environment, you perform these tasks using the PTE Server panel:
The PTE requires a connection to a running Services Gatekeeper implementation through a database domain. You can use PTE to control any running Services Gatekeeper server by changing the Hostname, Port number, and an administrative Username and Password. Figure 2-1 shows where you enter Services Gatekeeper login fields. The Server Configuration tabs and their sub-tabs are also marked.
Figure 2-1 The Server/Application Configuration Panel
To connect to Services Gatekeeper:
Do one of the following:
If you started the PTE from your system's Start menu, it automatically connects to the corresponding Services Gatekeeper implementation.
To connect to a different Services Gatekeeper implementation, enter the Hostname, Port, Username and Password that you configured in that database domain and click Connect.
In the tools selection panel, click Server.
Figure 2-2 shows the application-facing tools selection panel with the Server item selected.
Figure 2-2 The Application-facing Tools Selection Panel
Click the MBean sub-tab.
Click Connect. The MBean tree is populated.
To switch to a different Services Gatekeeper implementation:
Click Disconnect.
Enter the Hostname, Port, Username, and Password that you configured in the database domain.
Click Connect.
You configure communication services by changing their MBean attributes and operations. You use the MBean tab to change individual MBean attributes and perform MBean operations. These changes persist in the database. You can also record a series of changes in a script and use the script to repeat the changes as needed.
This section assumes that you know the configuration changes you want to make for each communication service. For details on the configuration choices, read through the Oracle Communications Services Gatekeeper Communication Service Guide, a separate document in this set.
To configure a communication service:
Connect to a Services Gatekeeper implementation.
In the tools selection panel, click Server.
Click the MBean sub-tab.
Click the Browser sub-tab which displays the list of available MBeans.
Select an MBean to modify. The MBean attributes are displayed in the panel to the right of the MBean.
Make any changes to the MBean attribute or operation.
Click the green down arrow (for attributes) or right--facing triangle (for operations) to save your changes to the database.
Select and edit any other MBeans as necessary to configure the communication service.
You can record and repeat your MBean configuration changes using the Scripts sub-tab. You can run these scripts manually or programatically later as needed.
To create an MBean script:
Connect to a Services Gatekeeper implementation.
In the tools selection panel, click Server.
Click the MBean sub-tab.
Click Record.
The Recording starts.
Perform the MBean tasks to capture.
Click Recording.
Enter a name for the script and click OK.
Your new script appears in the Scripts sub-tab.
MBean scripts automate the process of changing your MBean operations and attributes.
To run an MBean script:
Connect to a Services Gatekeeper implementation.
In the tools selection panel, click Server.
Click the Scripts sub-tab.
Select a scrip to run.
Click Run.
Services Gatekeeper keeps track of communication service behavior by recording Event Data Records (EDRs) at logical points as the communication service communicates with applications, the network, and the database. You can track and debug communication service behavior by viewing the EDRs in the PTE. For details on the list of EDRs generated by each communication service, see Oracle Communications Services Gatekeeper Communication Service Guide, another document in this set.
You use the Event Data Record tab to view EDR data. Figure 2-3 shows the Event Data Record tab populated with EDRs. EDR data is shown, including the EDR number, Type, ID number, a timestamp, and the EDR description. The Dynamic Filter boxes that limit the EDRs displayed are marked, as is the Counter Mode check box. The EDR key/value pairs are shown for EDR number 24 in the detail window at the bottom.
To view EDRs for a communication service:
Connect to a Services Gatekeeper implementation.
Run a communication service.
Each communication service generates a unique list of EDRs.
In the tools selection panel, click Server.
Click the Event Data Record sub-tab.
Click Connect.
The list of EDRs generated by the communication service is displayed
Select an EDR to view its details in the panel below it.
To export, import, or copy to the clipboard a list of EDRs, use the icons in the bottom left of the EDR list window.
To avoid performance degradation in situations where you are expecting a large number of EDRs, check the Counter Mode box. This returns a count of the number of records, but does not display the entire contents.
Click Server Log to view the server logs. Figure 2-4 shows the Server Log tab populated with sample server log messages.
Figure 2-4 Server Log Message and Detail Panels
To view EDRs for a communication service:
Connect to a Services Gatekeeper implementation.
Run a communication service.
Each communication service generates a unique list of EDRs.
In the tools selection panel, click Server.
Click the Server Log sub-tab.
Click Connect.
Server log messages is displayed
Select a log message to view its details in the panel below it.
To export server log messages to a file, click the export icon on the right side of the panel. To clear the list of server logs, click the trash can icon on the right side of the panel.
You can do a lot of testing without connecting the PTE to a database. For example you can verify communication service features and make changes to the SLAs. However, to confirm that your changes make the correct database changes, you need to connect the PTE to a running database. Use the Database Configuration panel to view and change the database connection and database tables. Figure 2-5 shows the Database Configuration panel populated with database tables. A table is selected and its fields shown.
Figure 2-5 The Database Configuration Panel
The Database panel has two sub-tabs:
Use the Command sub-tab to enter SQL commands directly into the database.
Use the Database sub-tab to view database tables and the data in them. To monitor a specific table more closely, select it and click Detach. That table appears individually as an additional tab.
This procedure requires that you know the database URL, driver, username, and password.
To View Database Tables and Fields:
Connect to a Services Gatekeeper implementation.
From the tools selection panel, click Database.
In the URL field, enter the URL of a database to connect to.
In the Driver field, enter the driver of a database to connect to.
In the Username field, enter the name of a database administrative user in the database to connect to.
In the Password field, enter the password for the administrative user.
Click Connect.
Click the Database sub-tab.
The Database sub-tab is populated with database fields. The Tables panel on the left displays the database tables.
Select a table to display its fields in the panel on the right.
The PTE database command line allows you to run SQL commands directly on your database. Figure 2-6 shows the Command tab window with the SQL command line marked.
This procedure requires a strong knowledge of SQL.
This procedure requires that you know the database URL, driver, username, and password.
To run an SQL command against the database:
Connect to a Services Gatekeeper implementation.
From the tools selection panel, click Database.
In the URL field, enter the URL of a database to connect to.
In the Driver field, enter the driver of a database to connect to.
In the Username field, enter the name of a database administrative user in the database to connect to.
In the Password field, enter the password for the administrative user.
Click Connect.
Click the Command sub-tab.
The Command dialog box is displayed.
Enter an SQL command line to execute on the database.
Use the Clients tool to select and configure your application-facing interfaces (clients) and your Services Gatekeeper connection. Figure 2-7 shows the categories of clients available to configure for testing.
Figure 2-7 Configuring Application-facing Clients to Test
Use the Session button to configure the Services Gatekeeper connection.
Use the Messaging button to configure the Service Gatekeeper messaging applications, such as Short Messaging, Multimedia Messaging, and so forth.
Use the Call Control button to configure Audio Call, Call Notification, and Third Party Call applications.
Use the Mobility button to configure Terminal Location, Terminal Status, and Presence applications.
Use the PRM button to configure Partner Relationship Management operator and service provider applications.
Use the Other button to configure Subscriber Profile, Payment, Device Capabilities, and Netex applications.
Each application has unique configuration parameters organized by sub-tab. Figure 2-8 shows the Mobility applications, (Terminal Location, Presence, and Terminal Status) available to configure and test. The Terminal Status tab is selected, showing the parameters in the Status sub-tab.
Each communication service requires a simulated network to test with the PTE. You use the network-facing simulator panel, in the lower part of the PTE, to configure simulated telecom network components and settings. There are three categories to choose from:
Map displays a test map of a physical location that you can add network components to.
Simulator offers the network protocols available to use as network-facing interfaces. This button also offers the Diameter billing feature.
Web Server simulates an HTTP web server.
The Maps panel provides a map on which you can place sample phone terminals, mobile trucks, and connect them with sample coverage contact areas. This offers visual support for testing Parlay X 2.1 SMS, MMS, and Terminal Location traffic and their RESTful equivalents. Use the plus button on the bottom left to create your own sample test elements.
Figure 2-9 shows the Map panel with the Maps elements on the left side and the simulated map on the right. The map has an example telephone, truck, and circular notification area deployed on it.
To add an element to the map:
Connect to a Services Gatekeeper implementation.
Select the Map button at the bottom of the PTE screen.
The Map appears.
Click the green plus icon at the bottom of the Elements sub-tab.
The Add Element screen appears.
Select the type of element to add.
The Properties screen appears. Do one of the following:
For a cell phone, enter:
An address.
A longitude.
A latitude.
An altitude.
A status (reachable, unreachable, busy)
For a circular notification area, enter:
An id.
An address.
A trigger.
A longitude.
A latitude.
A radius.
An interval.
A duration.
A count.
For a TS (terminal Status) notification area, enter:
An id
An address.
For a truck, enter:
An address.
A longitude.
A latitude.
An altitude.
Click OK.
The new element appears on the map.
You can use any .gif or .jpeg file for the map image.
To change the Map image:
Connect to a Services Gatekeeper implementation.
Select the Map button at the bottom of the PTE screen.
The Map panel appears.
Click the Map Properties icon on the bottom right of the map panel.
The Map Properties panel appears.
Click the Custom Image radio button.
Click the Browse button and navigate to the location of an image to use for the map.
Click OK.
The Map Properties panel disappears and the new image is displayed in the PTE Map panel.
You can use any longitude and latitude ranges for the map image.
To change the Map longitude and latitude ranges:
Connect to a Services Gatekeeper implementation.
Select the Map button at the bottom of the PTE screen.
The Map appears.
Click the Map Properties icon on the bottom right of the map panel.
The Map Properties panel appears.
Enter new values for the longitude and latitude ranges.
No validation checking is performed on longitude or latitude. You can enter any values regardless of whether they make sense.
Click OK.
The Map Properties panel disappears and the new ranges are displayed in the PTE Map panel.
Each communication service requires a network-facing protocol to test against, and you configure them using the Simulators button in the lower part of the PTE. Figure 2-10 shows the network simulator components.
Figure 2-10 Configuring a Network Protocol to Test With
To configure a network protocol for testing:
Connect to a Services Gatekeeper implementation.
Select the Simulators button at the bottom of the PTE.
Select a network protocol from the tabs available.
Configure, start, and view results from the protocol using the sub-tabs available.
The number and type of protocol configuration sub-tabs offered depends on the individual protocol. In all cases, there is a Controls tab to configure the protocol. This area is also where the Start button is for each of the modules. The other tabs vary; for example, they may allow you to see the actual content of a message or show you the statistics associated with traffic.
The Diameter tab allows you to set up and run any billing simulator integrated with the Diameter protocol. For example, to use the billing simulator with the Payment communication service, create a user in the billing simulator corresponding to the endUserIdentifier field in the Payment client, and send a request from the client through the Diameter simulator to the Billing simulator.
Do not use an existing localhost value for the Diameter Origin Host parameter in the Payment communication service. You must use the actual name of a host. Figure 2-11 shows the Diameter simulator Controls tab.
Figure 2-11 The Diameter Simulator Controls Tab
To configure Diameter testing:
Create a Diameter plug-in instance.
Connect the PTE to a Services Gatekeeper implementation.
Click the Simulators button at the bottom of the PTE GUI.
Click the Diameter tab.
Click the Controls sub-tab.
Enter a Diameter realm to use.
Enter the first Diameter request listener port in the port1 field. This port can accept either Rf (ACR; post-paid) or Ro (CCR; pre-paid) requests, and can be a multi-home port. The default value is 3588.
Enter the second Diameter request listener port in the port2 field. This port can also accept either Rf (ACR; post-paid) or Ro (CCR; pre-paid) requests, and can be a multi-home port. The default value is 3589.
(As needed) Change the failingSubscriberIdData identifier.
The default identifier (123123) is an Oracle-supplied subscriber account that does not have any funds. This is useful for testing “insufficient funds” scenarios. Change this if you need to.
(As needed) Check the recordBillingEvents checkbox.
Checking this box directs the PTE to record and display billing events.
(As needed) Check the dumpMessage checkbox to delete Diameter messages.
Checking this box directs the PTE to delete Diameter messages instead of sending them to the PTE output panel.
(As needed) Enter an alternate value for maxRecordBillingEvents.
This value specifies the maximum number of billing events that the PTE records. As new billing events arrive the older events are deleted.
Select Start to start the Diameter service.
These next steps are necessary to specify the listening ports for your Diameter simulator in Services Gatekeeper.
Select the Multi-home sub-tab.
Copy the top port number or IP address to your system clipboard by clicking the Copy to Clipboard icon.
Select the Server tool in the upper right of the PTE GUI.
Select the MBean sub-tab.
Select Connect.
The MBean tree appears.
Select wlng_nt_payment_px30#5.1 > Diameter_plugin_name > PaymentMBean.
Paste the IP address from your clipboard into the DestinationAddresses attribute field.
Add a comma immediately after the IP address.
Return to the Diameter Multi-home sub-tab and copy the lower IP address to your clipboard.
Return to the MBeans sub-tab and paste the second IP address in the DestinationAddresses field after the comma without any blank spaces.
Select the green down arrow to make the change take effect.
You can add additional addresses up to a 255 character limit.
Select Disconnect in the MBean Browser tab, then select Connect again.
Select wlng_nt_payment_px30#5.1 > Diameter_plugin_name > PaymentMBean > Connected.
Confirm that the Connected checkbox is checked, indicating that the PTE is now connected to the destination addresses.
The Web Server button offers configuration and output for a simulated HTTP server. This simulator is required to run traffic over HTTP based protocols like MM7.
Set up and start a web server simulator:
Connect to a Services Gatekeeper implementation.
Click the Web Server button at the bottom of the Network Simulator panel. The Web Server Controls tab appears. Figure 2-12 shows the Web Server Controls tab.
Enter the host of the web server to use.
Enter a port for the web server to use.
Enter contextPath (/axis by default) for the web server to use.
Click Start to start your web server.
The web server starts.
Click the Output tab and check for web server messages.
Figure 2-13 shows an example Controls tab populated with web server messages.
SLAs are XML files that you use to control your partners' access to the services that Network Gatekeeper manages. For details on SLAs, see Oracle Communications Services Gatekeeper Accounts and SLAs Guide, another document in this set.
To help you manage SLAs, the PTE includes an SLA Browser, which displays SLAs, and an SLA Editor, which you use to change tags and validation. In a test environment, changing details multiple times for various iterations of testing is common, and these tools free you to focus on setting values.
To access the SLA Manager:
Connect to a Services Gatekeeper implementation.
In the tools selection panel, click Server
Click the MBean sub-tab.
Click Connect.
Pull down the Tools menu from the top of the PTE, and select SLA Manager.
The SLA Manager appears displaying the example SLAs available in the default SLA directory: Middleware_Home/ocsg_pds_5.1/pte/resource/sla.
Figure 2-14 shows an example SLA Browser with SLAs available and the various SLA Browser tools highlighted.
The example SLAs model the various options for SLA construction. To display a different SLA file, click Change and select it using the file browser that appears. To create a new SLA, click the Plus button in the upper left corner of the SLA Browser window. You can also delete or rename SLAs from the same area.
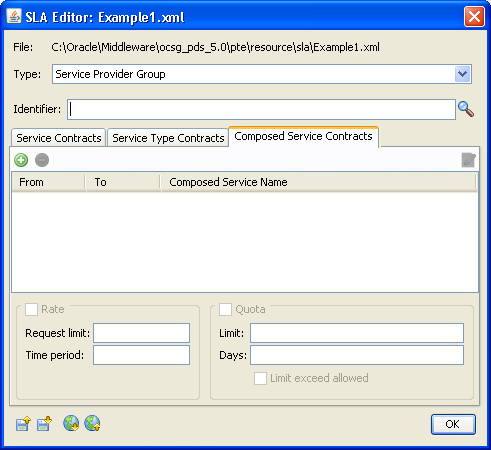
To view a SLA XML file, select it, then click the eye icon in the upper right corner of the pane. To edit an SLA, select it and click the pencil icon in the upper right corner. The SLA Editor window appear. Figure 2-15 shows the SLA Editor window with its controls highlighted.
Select the SLA Type from the dropdown menu and specify the group identifier. Use the import and export icons on the bottom left to import an SLA from the file system or to save changes. Use the upload and download icons on the bottom left to upload the SLAs to, or download them from Services Gatekeeper.
You edit Service Contracts and Service Type Contracts using the tabs in the upper window, and edit any Overrides in the lower. To edit a Service Contract, click it and the Contract Editor window appears. Figure 2-16 shows the Contract Editor window and the elements available to add or change.
The editable tags appear as tabs at the top of the window. Make any changes and click OK to save them and close the window. For more information on these tags, see the “Defining Service Provider Group and Application Group SLAs” chapter in Oracle Communications Services Gatekeeper Accounts and SLAs Guide, a separate document in this set.
Figure 2-16 shows a new rate method restriction being added to SLA_test1.xml. Click OK to save your changes.
Click OK once again (on Figure 2-15) to finish.
To preview your edits in XML format, click the Eye icon at the top left of the SLA Browser (Figure 2-14). The Preview SLA window opens. See Figure 2-17.
The Method Restriction rate limit that was added in Figure 2-17 is shown outlined in red.
When you have completed your edits, click the Close button on the SLA Browser window.
This section describes how to use the SLA Manager in the PTE to edit a composed service contract in Oracle Communications Services Gatekeeper.
The PTE provides a graphical interface to the SLA editor for creating and managing composed SLAs. When a user modifies a composed SLA using this editor the corresponding XML file is updated immediately.
The editor provides browsers that provide access to information needed to create and manage SLAs, such as the available identifiers, communication service names, and methods.
For information about composed service contracts, see the discussion of the structure of a composed service contract in Oracle Communications Services Gatekeeper Accounts and SLAs Guide.
To start the Composed SLA Editor:
In the PTE, connect to Services Gatekeeper and start the SLA Manager.
In the SLA Manager, select the Composed Service Contracts tab.
The Composed SLA Editor appears.
If you have an existing Composed SLA that you want to edit, you can download it from the Services Gatekeeper server.
To download an existing SLA:
With the Composed Service Contract tab selected, select the type of SLA from the Type menu.
Enter the identifier for the SLA in the Identifier field. You can click the search icon to browse for the identifier:
Select the SLA to download.
Click download icon at the bottom of the editor to download the SLA:
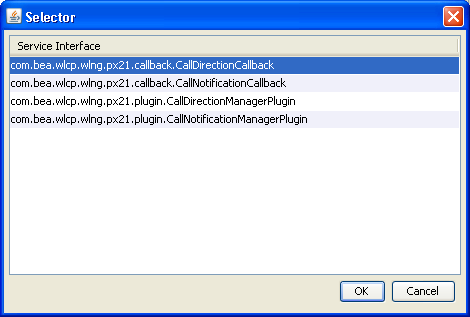
The Selector box appears.
Select the contract that you want to download from the Selector box.
Click OK.
To create a new Composed SLA:
With the Composed Service Contract tab selected, select the type of SLA that you want to create from the Type menu.
Assign a unique identifier for the composed SLA in the Identifier field.
Click the add icon to create a new SLA:
The new SLA appears in the editor.
Add the start and end dates and the composed service name.
See Composed Service Name and Start/End Dates for instructions on how to assign a name and dates to the composed service contract.
Click OK.
You can edit the following values in a new or previously existing contract:
For details about what these values represent, see the discussion of defining service provider group and application group SLAs in Oracle Communications Services Gatekeeper Accounts and SLAs Guide. The following sections describe only the mechanics of modifying these values in the editor.
To change the Composed Service Name, start date (From field), or end date (To field):
In the composed service editor with the Composed Service Contract tab selected, click the field that you want to modify.
Over-write the existing value with the new value.
If you are editing the Composed Service Name field, make sure to enter a unique name for the composed service.
Click OK.
To edit the rate or quota at the bottom of the editor, with the SLA selected:
Check the check box for the rate or quota to be enforced by the SLA.
Enter the values for the rate or quota to be applied.
Click OK.
This section describes how to add communication services to the composed service and how to specify the methods that the composed service contract applies.
The methods portion is optional. If no methods are specified, the enforcements apply to all of the communication services's methods. If at least one method is specified, only the specified method or methods participate in the composed service.
To add the communication services that define the composed service contract:
Select the Composed SLA in the editor.
Click the edit icon:
The Service Type of Composed Service box appears. Use the upper pane to add communication services.
Figure 2-19 Service Type of Composed Service Box
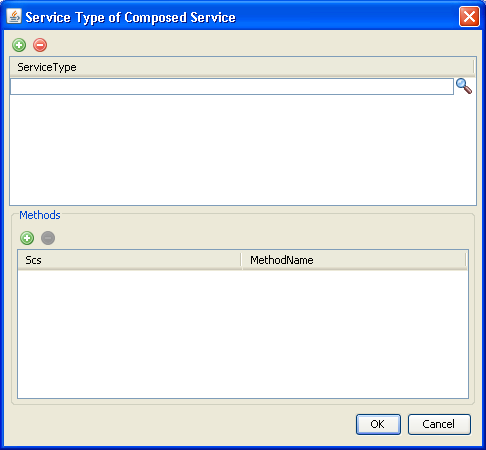
For every communication service that you want to add to the composed service, do the following:
In the Service Type of Composed Service pane, click the add button to add a service.
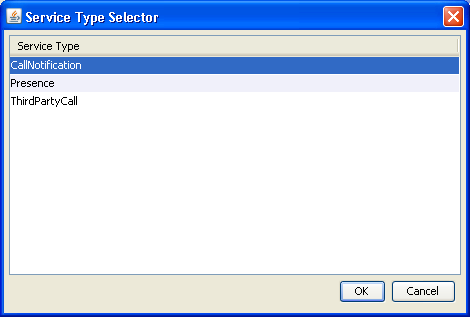
Click the search button to load the list of available communication services.
The Service Type Selector list appears.
In the Service Type Selector box, select a service type.
Click OK.
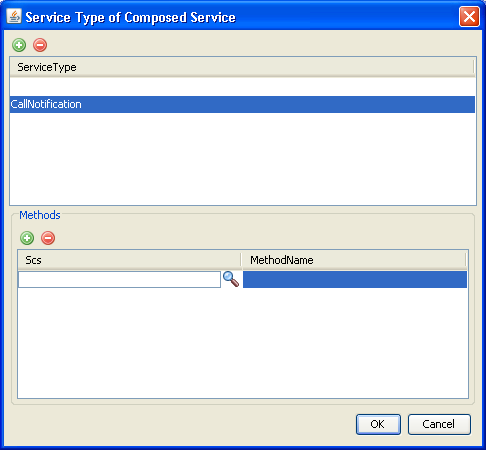
If you want to limit SLA enforcement to specific methods of a communication service, use the lower pane of the Service Type of Composed Service box.
To specify a method to which the composed service contract enforcements are applied:
With the communication service selected in the upper pane of the Service Type of Composed Service box, click the add button in the lower pane.
A row for the method appears in the lower Scs pane.
Figure 2-21 Service Type of Composed Service Box with SCS Search Button
Click the search button.
The Scs Selector box appears.
Select the service interface.
Click OK.
The service interface appears in the lower pane of the Service Type of Composed Service box.
Click the Method Name area next to the selected Scs to display the available methods for the Scs.
A menu of the available methods appears.
Figure 2-23 Service Type of Composed Service Box with Method Menu
Select a method name from the menu.
Click OK
Repeat this procedure for every method that you want to add to the SLA enforcement.
To upload the edited SLA:
Select the SLA in the editor and click the upload icon:
An alert asks whether the composed SLA is geo-redundant or local.
Respond to the alert by clicking the Geo-redundant or Local button.
A local SLA is enforced locally in the network tier cluster into which it is loaded. A geo-redundant SLA is loaded to and enforced across all network tier clusters in a geo-redundant configuration.
The composed SLA is uploaded.
Budgets measure the level of access an application has to Services Gatekeeper over time. For details on budgets, see “Managing and Configuring Budgets” in Oracle Communications Services Gatekeeper System Administrator's Guide for details.
You must create instances of certain communication services to use them in Services Gatekeeper. For these communication services, only Service Types that have been instantiated show up in the Selector panel.
To monitor budget use:
Connect to a Services Gatekeeper implementation.
In the Tools Selection panel, select the Server.
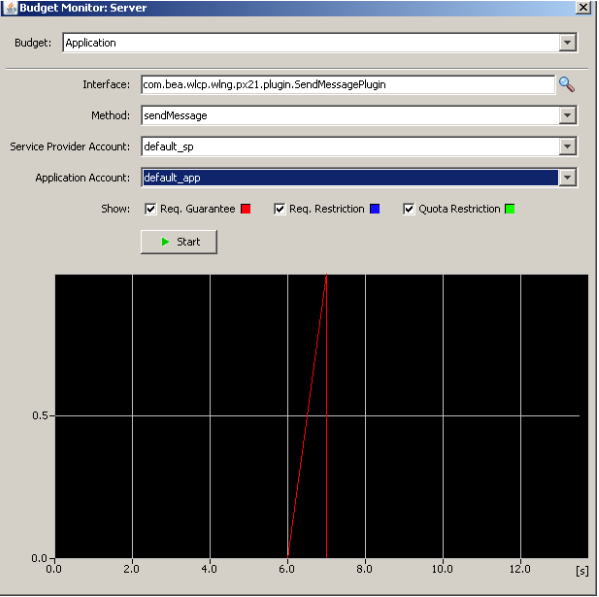
From menu bar at the top left of the PTE GUI, select the Tools menu, and then Budget Monitor. The Budget Monitor window appears. Figure 2-24 shows the Budget Monitor window.
From the Budget drop-down list, select a type of budget to monitor.
If you selected an Application or Service Provider, do the following:
The Selector window appears. Figure 2-25 shows the Selector window populated with service types and service interfaces.
Select the Service Type and a Service Interface to monitor.
Click OK. The Selector window closes and the Budget Monitor window reappears.
Select a Method and its associated Service Provider Account from the lists.
Click Start.
The X-axis indicates time in seconds and the Y-axis the amount of budget that is available. The number of units in the Y-axis depends on values assigned in the SLA for the selected budget. Rates, quotas, and restrictions can all be mapped.
|
Copyright © 2008, 2013, Oracle and/or its affiliates. All rights reserved. Legal Notices |
|