Suppose you have a Strategic Finance entity with revenue and cost accounts projected out for a number of years beyond 2008. You can choose several accounts and years and estimate the probability of earning certain net incomes in a particular year. In this case, you want to analyze Unit Volume, Product Price, and Cost of Goods Sold for the years 2008, 2009, and 2010. You want to determine the probability of obtaining several ranges of net income.
 To perform these estimates:
Start Crystal Ball EPM and run the Strategic Finance Setup wizard (Running the Strategic Finance Setup Wizard).
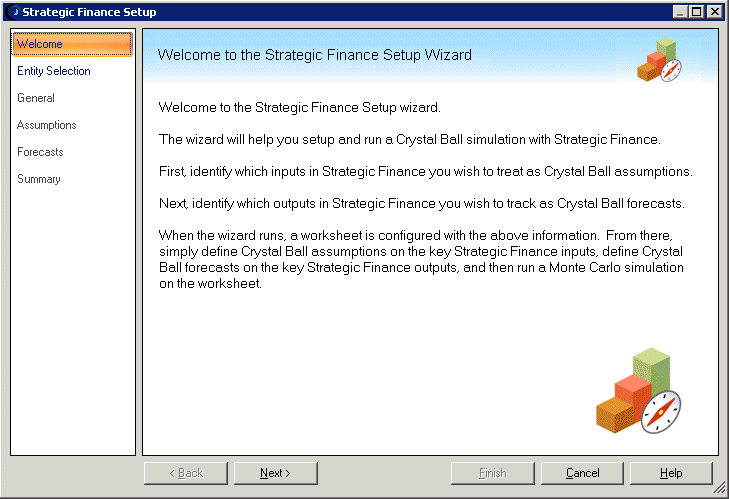
If this is the first time you run the wizard, the Welcome panel opens (Figure 4, Welcome Panel, Strategic Finance Setup Wizard).
If the Welcome panel is displayed, click Next to display the Entity Selection panel, complete its settings, and then click Next to move to the next panel.
For this example, you make the following settings:
On the Entity Selection panel, you can select a Strategic Finance entity, either on a local disk or a server. You select sample.alc on your computer.
On the General panel, you select the Base scenario and the years 2008, 2009, and 2010.
On the Assumptions panel, you can select input assumptions, variables you can’t control. You select two accounts related to revenue, Unit Volume and Product Price, and one cost account, Cost of Goods Sold.
On the Forecasts panel, you select Net Income as the output forecast to investigate.
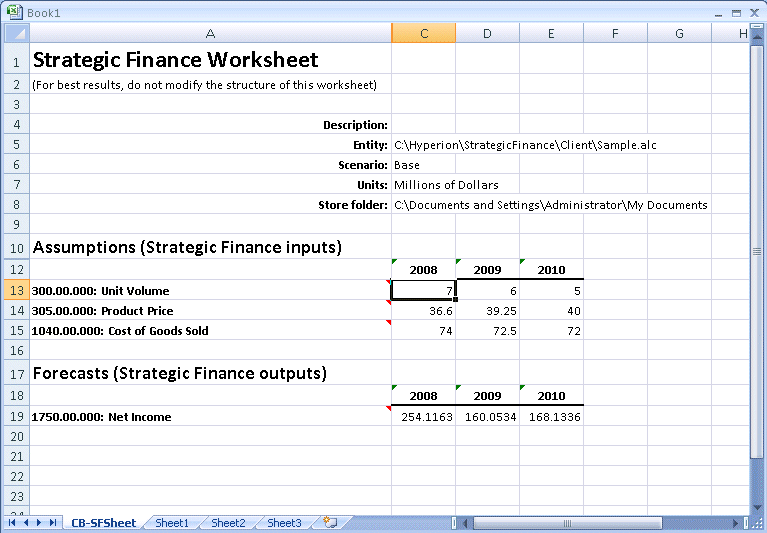
Click Finish to produce the Strategic Finance Worksheet (Figure 5, Strategic Finance Worksheet). It shows the selected entity, scenario, and accounts.
You decide to define all the cells in the Assumptions group as Crystal Ball assumptions using the normal distribution and default mean and standard deviation.
The mean is the original cell value and the standard deviation is a tenth of that value.
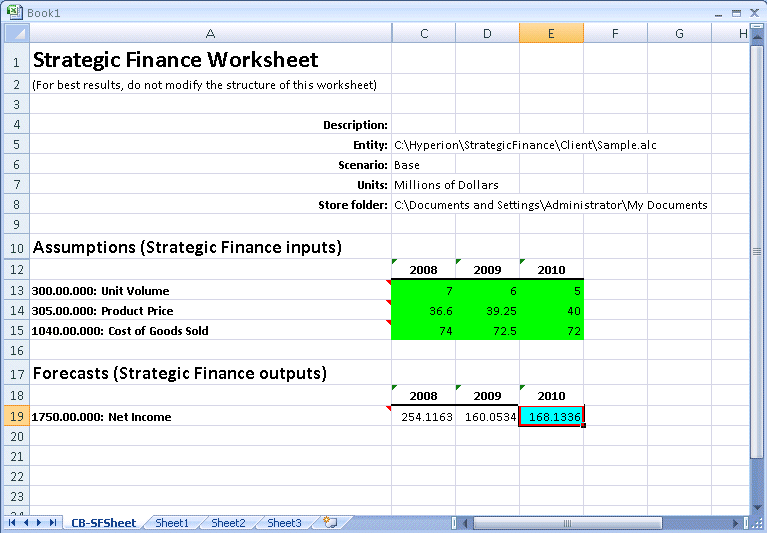
Because you are only interested in Net Income for the year 2010, you select cell E19 and define it as a Crystal Ball forecast.
This works because it is related to at least some of the assumption cells.
The Crystal Ball EPM data cells are now defined. The assumption cells are green and the forecast cell is blue (Figure 6, Strategic Finance Worksheet with Crystal Ball Data Cells).
Note:
If you are unable to distinguish these two colors, you can use the Crystal Ball cell preferences to change the colors or use patterns instead. For details, see the Oracle Crystal Ball User's Guide.
Now you can run a Crystal Ball simulation against the model.
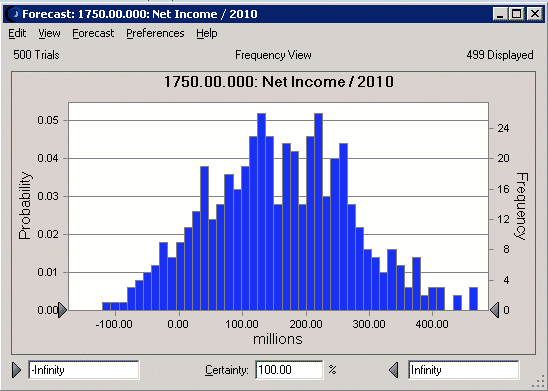
You run 500 trials. A forecast chart appears for 2010 Net Income (Figure 7, Crystal Ball Forecast Chart for 2010 Net Income).
You type different values into the forecast chart to explore the probability of different events occurring.
As illustrated in the following steps, when you type values into the certainty minimum, certainty maximum, and the certainty value fields, you can determine the probability of achieving a value between the certainty minimum and maximum.
You learn the answers to several questions.
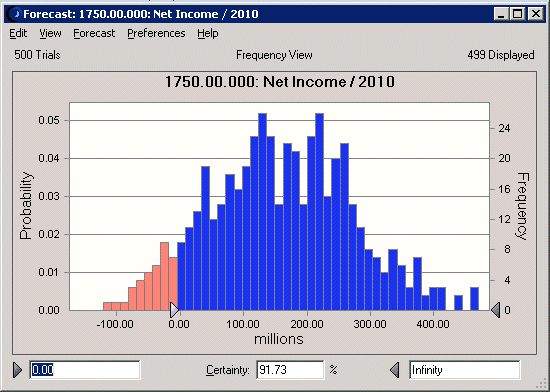
There is about a 92 percent probability of breaking even, achieving Net Income greater than 0 (Figure 8, Forecast Chart for 2010 Net Income Greater than $0).
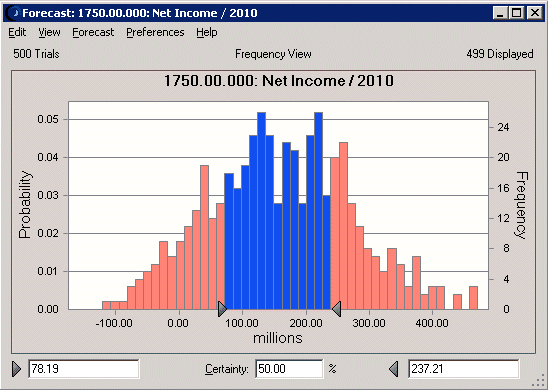
There is a 50% probability of earning Net Income between about 78 and 237 million dollars (Figure 9, Forecast Chart for the Middle 50% of 2010 Net Income).
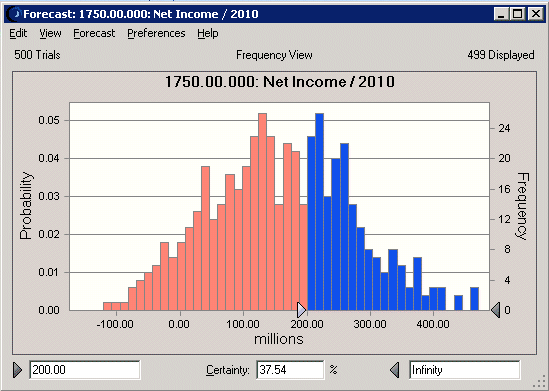
You determine that the probability of earning Net Income greater than 200 million dollars is just under 38% (Figure 10, Forecast Chart for 2010 Net Income Greater than $200 Million).
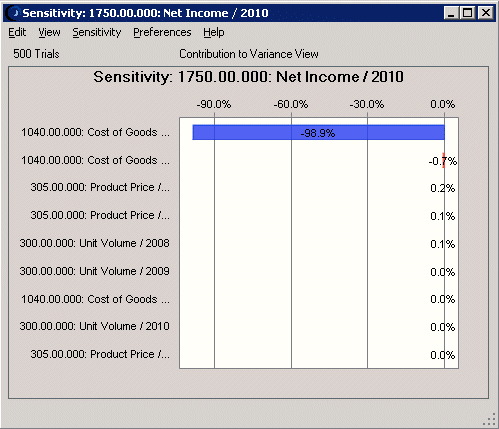
Finally, you generate a sensitivity chart of all defined assumptions against the 2010 Net Income forecast (Figure 11, Sensitivity Chart for 2010 Net Income). You see that 2010 Cost of Goods is responsible for over 98% of the variance in 2010 Net Income. You decide to focus efforts on reducing those costs.
You close the Strategic Finance Worksheet and all the charts.
The next time you want to review the worksheet or charts, you can simply open Strategic Finance and select Analysis, then What If Analysis, then Crystal Ball. You can then select Models to open a worksheet and Results to open the charts for further analysis of the simulation results. Each time you use the wizard to set up an Crystal Ball model and then run a simulation against that model, the results and the model are stored for future use.
