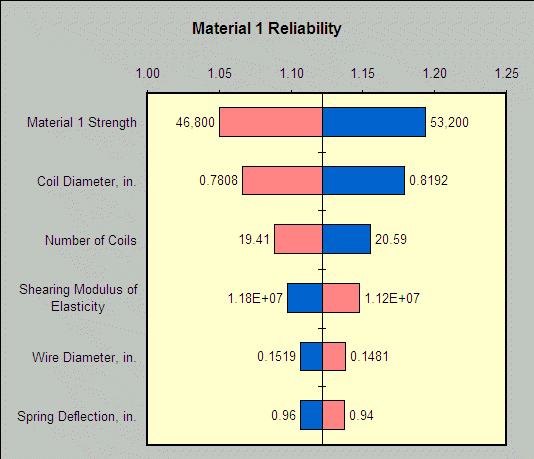
One of the easiest ways to increase the effectiveness of your optimization is to remove decision variables that require a lot of effort to evaluate and analyze, but that do not affect the objective very much. If you are unsure how much each of your decision variables affects the objective, you can use the Tornado Chart tool in Crystal Ball (see the Oracle Crystal Ball User's Guide for more information on the Tornado Chart).
The Tornado Chart tool shows how sensitive the objective is to each decision variable as they change over their allowed ranges. The chart shows all the decision variables in order of their impact on the objective.
Figure 72, Crystal Ball tornado chart shows a Crystal Ball tornado chart. When you view a tornado chart, the most important variables are at the top. This arrangement makes it easier to see the relative importance of all the decision variables. The variables listed at the bottom are the least important in that they affect the objective the least. If their effect is significantly smaller than those at the top, you can probably eliminate them as variables and just let them assume a constant value.
Before running the Tornado Chart tool, run an initial optimization so that the base case values of the decision variables are close to the optimal solution for your model. You can use the Tornado Chart tool to measure the impact of your decision variables. For information, see Viewing a Solution Analysis.
