Following an optimization, you can create several different types of OptQuest reports.
 To create an OptQuest report:
In the Create Report Preferences dialog, select one of the following:
Full, to create a complete OptQuest report including simulation results for the best solution
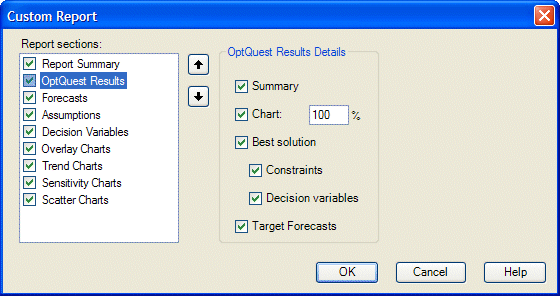
Custom, to display the Custom Report dialog, where you can choose which information — including OptQuest results — to display in the report.
Figure 7, OptQuest Results settings in the Custom Report dialog shows elements you can choose to include in the OptQuest Results section of a custom report.
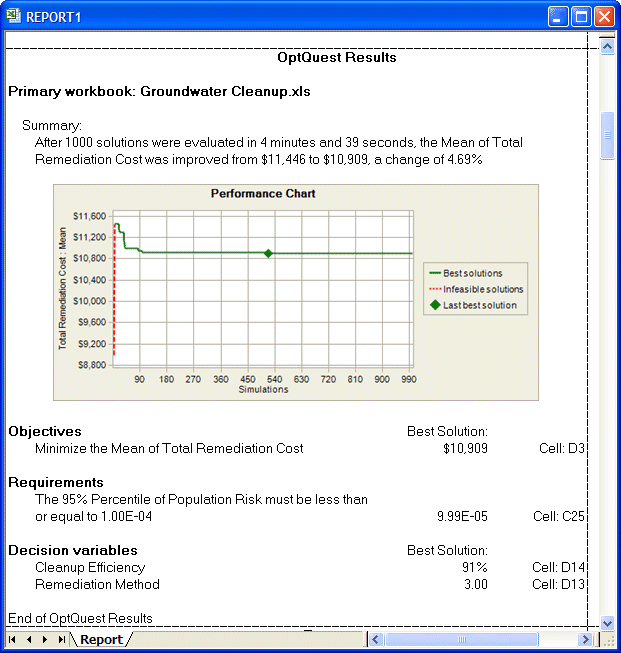
Click OK in the Create Report Preferences dialog to generate the report (Figure 8, Graphical OptQuest results in a custom report).
The first set of information is textual and numerical: related run preferences, run statistics, other statistics (such as number of infeasible solutions), and Crystal Ball data (the number of requirements, constraints, assumptions, decision variables, forecasts, and "frozen" items).
The second set of information is graphical, similar to that shown in Figure 8, Graphical OptQuest results in a custom report, and contains information displayed in the OptQuest Results window.
For more information about Crystal Ball reports, see the online Oracle Crystal Ball User's Guide.
Note: | If you run an Efficient Frontier optimization, you can only create a default OptQuest report. This is because there is more than one best simulation, one for each test point. To create a custom report or any other type of report with Efficient Frontier analysis, pick a test point and run a simulation for it. |

