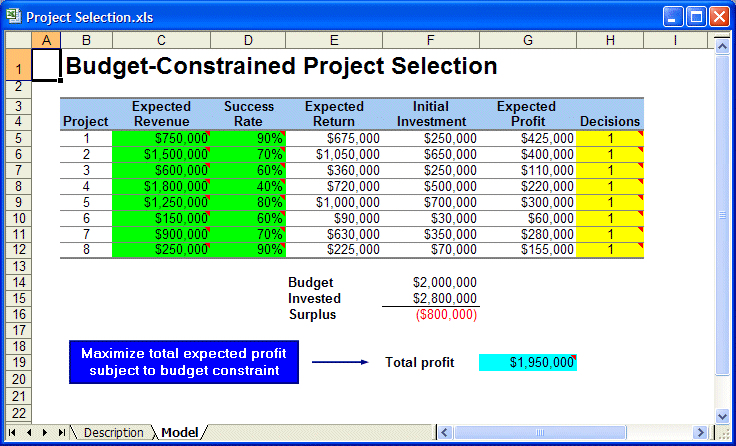
Figure 38, Project selection problem spreadsheet model shows a spreadsheet model for this problem, which you can view by opening the Project Selection.xls file. The decision variables in column H are binary; that is, they can assume only the values zero and one, representing the decisions of either not selecting or selecting each project. The total investment in cell F15 is the required investment in column F multiplied by the respective decision variable in column H.
The expected revenue and success rates are assumption cells in the Crystal Ball model. The expected revenues have various distributions, while the success rates are modeled using a binomial distribution with one trial. During the simulation, the outcomes in column D will be either 0% or 100% (not successful or successful) with the probabilities initially specified. Thus, for each simulated trial, the expected returns will either equal the expected revenue generated in column C or zero. Consequently, the expected profits can be positive or negative.
Although good solutions might be identified by inspection or by trial and error, basing a decision on expected values can be dangerous because it doesn’t assess the risks. In reality, selecting R&D projects is a one-time decision; each project will be either successful or not. If a project is not successful, the company runs the risk of incurring the loss of the initial investment. Thus, incorporating risk analysis within the context of the optimization is a very useful approach.
