With Project Selection.xls open in Crystal Ball, start OptQuest from the Crystal Ball Run menu. Then:
Figure 39, Project selection model optimization results shows the results of an OptQuest optimization. The best solution identified selects all the projects except for 2, 3, and 7.
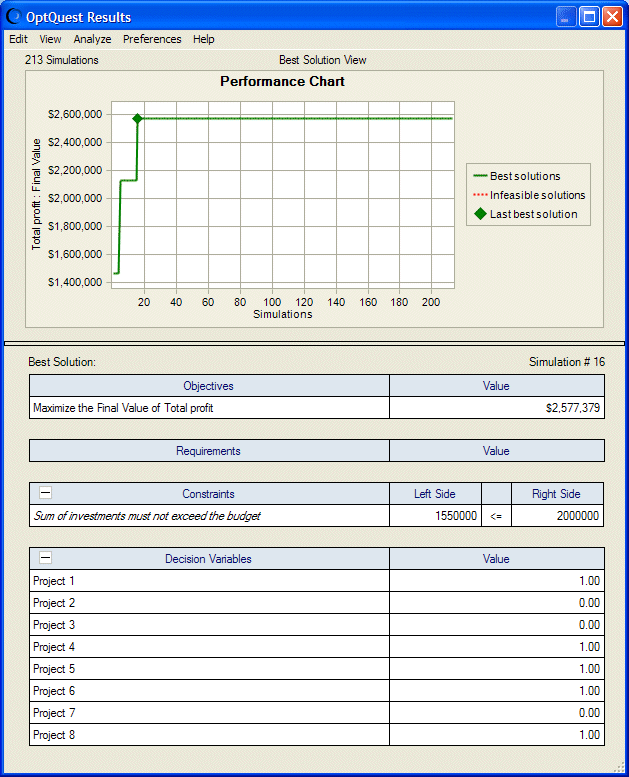
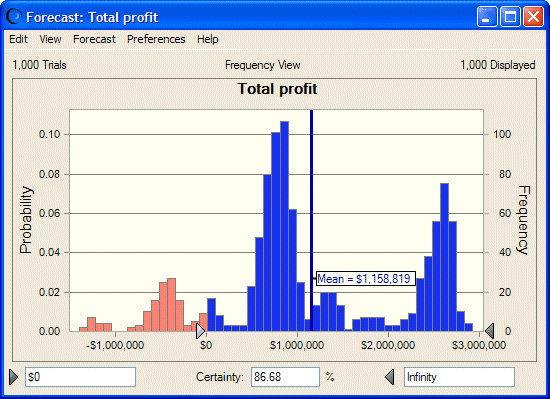
Figure 40, Project selection solution forecast chart, the forecast chart for Total Profit, shows that the distribution of profits is highly irregular, and depends on the joint success rate of the chosen projects. There is a risk of realizing a loss. You may want to evaluate the risks associated with some of the other solutions identified during the search.