Groundwater Cleanup Spreadsheet Model
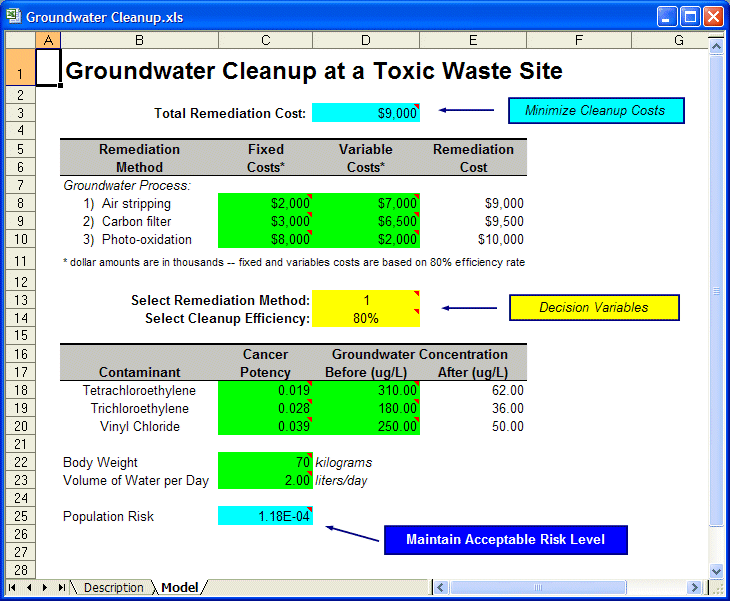
Open the file Groundwater Cleanup.xls (Figure 41, Groundwater cleanup spreadsheet model)
This model shows the population risk (cell C25), which is the overall contamination risk to the people in the community as a function of the factors shown in Table 8, following:
Table 8. Groundwater Cleanup population risk factors
Risk factors | Cells | Description | Distribution |
|---|
Cancer Potency | C18:C20 | Cancer potency of each contaminant. | Lognormal |
Concentration Before | D18:D20 | Concentration of each contaminant before cleanup. | Normal |
Volume Of Water Per Day | C23 | Interindividual variability of volume of water consumed each day. | Normal, with lower bound of 0. |
Body Weight | C22 | Interindividual variability of body weights in the community. | Normal, with lower bound of 0. |
Remediation costs of the various cleanup methods (cells E8:E10) are a function of factors shown in Table 9, following.
Table 9. Groundwater Cleanup remediation cost factors
Remediation cost factors | Cells | Description | Distribution |
|---|
Fixed Costs | C8:C10 | Flat costs for each method to pay for initial setup. | Triangular |
Variable Costs | D8:D10 | Costs for each method based on how long the cleanup takes. | Uniform |
Efficiency | D14 | Percent of contaminants that the cleanup process removes. Each remediation method has a different cost for different efficiency levels. | None |
