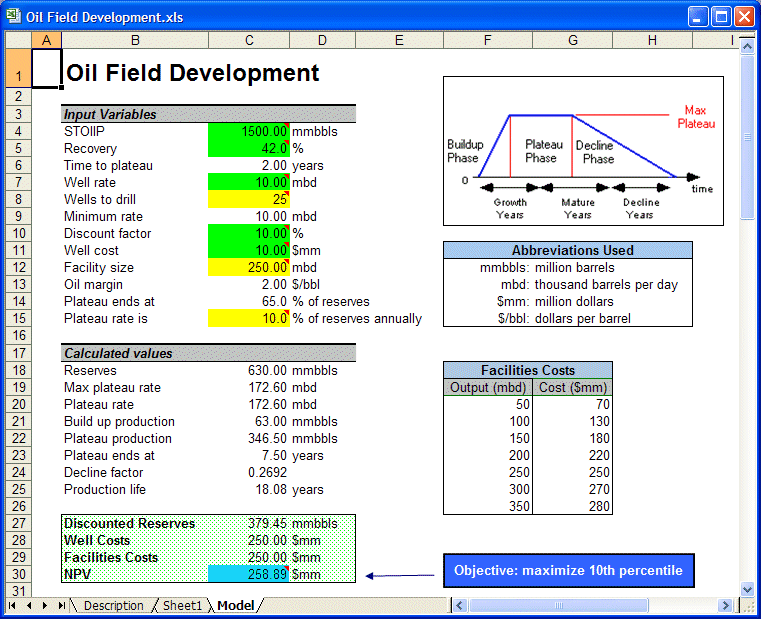
Open the Oil Field Development.xls workbook found in the Crystal Ball Example folder (Figure 45, Oil field development problem spreadsheet model).
Net present value (cell C30) of this oil field is based on:
Facility capacity places a maximum limit on production rate, while the production rate of the wells is defined as a normal distribution (cell C7).
The Production Profile table at the bottom of the model shows that the production phase determines annual production rates. Cumulative oil production is calculated per year and is then discounted at 10% (lognormal distribution in cell B10), resulting in a total discounted reserves value. The model gives an oil (or profit) margin of $2.00 per barrel (bbl) and converts total discounted reserves to present value dollars. Total well and facilities costs are then subtracted for total project NPV.
