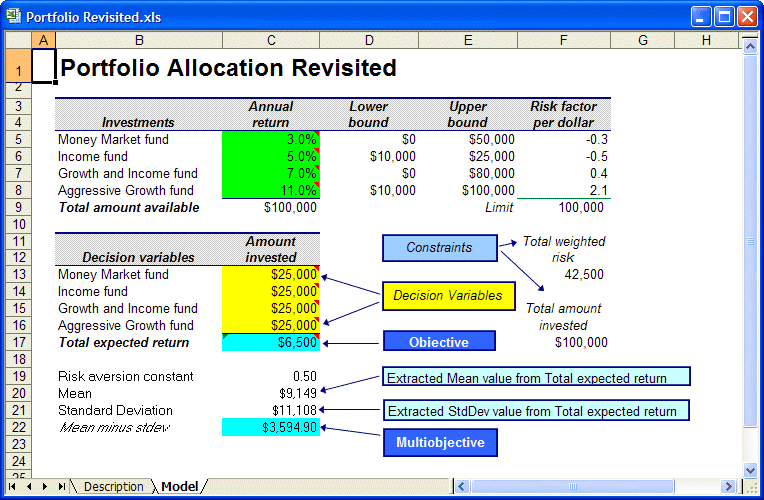
Open the Portfolio Revisited.xls workbook found in the Crystal Ball Examples folder. The total expected return forecast, assumptions, and decision variables are the same as in the original model. Scroll down to see the new items added as shown in Figure 50, Portfolio Revisited Spreadsheet Model.
This new function (cell C22) contains the multi-objective relationship described by mean return – (k * standard deviation) with the risk aversion constant (cell C19) broken out into a separate cell. The mean return and standard deviation variables in this equation are automatically extracted at the end of the simulation from the Total Expected Return forecast (cell C17). See the Oracle Crystal Ball User's Guide for more information on the Auto Extract feature.
