Except where indicated, this example uses the recommended Crystal Ball run preferences. See Setting Crystal Ball Run Preferences. |
 With Inventory System.xls open in Crystal Ball:
As you click Next to step through the problem, note:
The initial search limits are set between 200 and 400 for both variables using a Discrete decision variable type with a step of 5.
This optimization runs more slowly than some. You might want to run fewer than 1,000 simulations or use the Advanced Options settings to automatically stop the optimization when certain criteria are met (see Advanced Options). This example assumes that the automatic stop setting is selected.
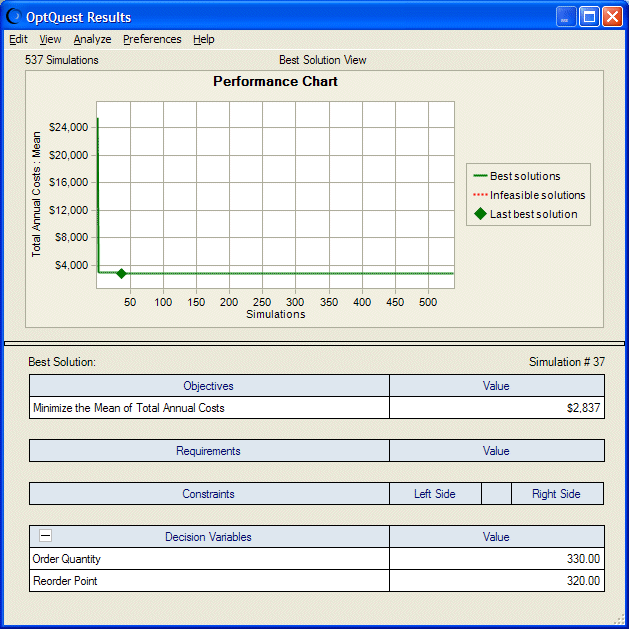
Figure 55, Inventory system model optimization results, following, shows optimization results. OptQuest identified the best solution as having an order quantity of 330 and a reorder point of 320. The Performance Chart shows that OptQuest quickly found a good solution value.
Because this optimization used a step size of 5, you can fine-tune the solution by searching more closely around the best solution using a smaller step size while also increasing the number of trials per simulation for better precision. This is a good practice, since choosing too small a step size initially consumes a lot of time or, if time is restricted, OptQuest might not find a good solution. Thus, as the number of decision variables and range of search increases, use larger step sizes and fewer trials initially. Later, refine the search around good candidates.
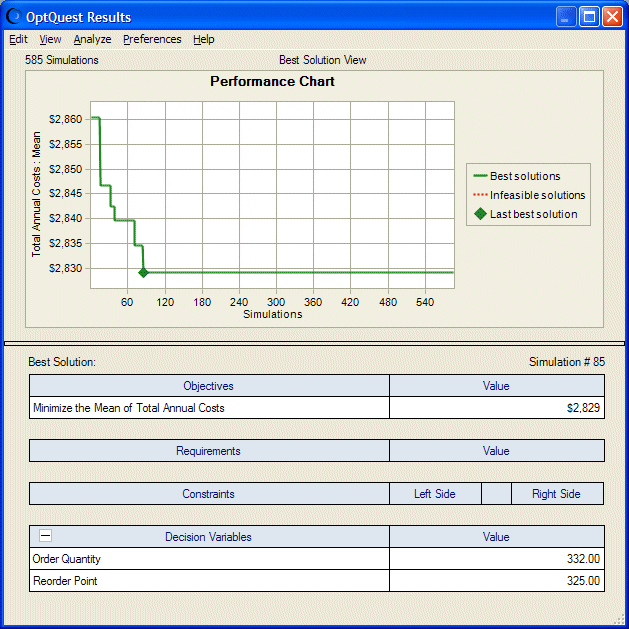
Figure 56, Inventory system—second optimization results shows the results of an optimization with Order Quantity and Reorder Point bounded to the range 300 to 360, with a step size of 1, and 1000 trials per simulation. OptQuest identified the best solution as Order Quantity = 332 and Reorder Point = 325. There was very little change from the initial solution.
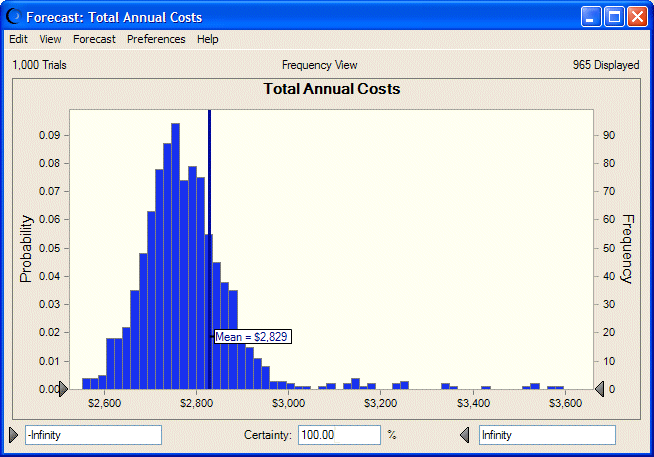
Figure 57, Inventory system final (best) solution forecast chart shows the Crystal Ball forecast chart for the annual total costs. You can see that the distribution of total annual cost is highly concentrated around the mean, but is also skewed far to the high-value end, indicating that very high values of cost are possible, although not very likely. For such highly skewed distributions, run more trials than usual, since statistics like the mean and tail-end percentiles can be susceptible to extreme outliers.


