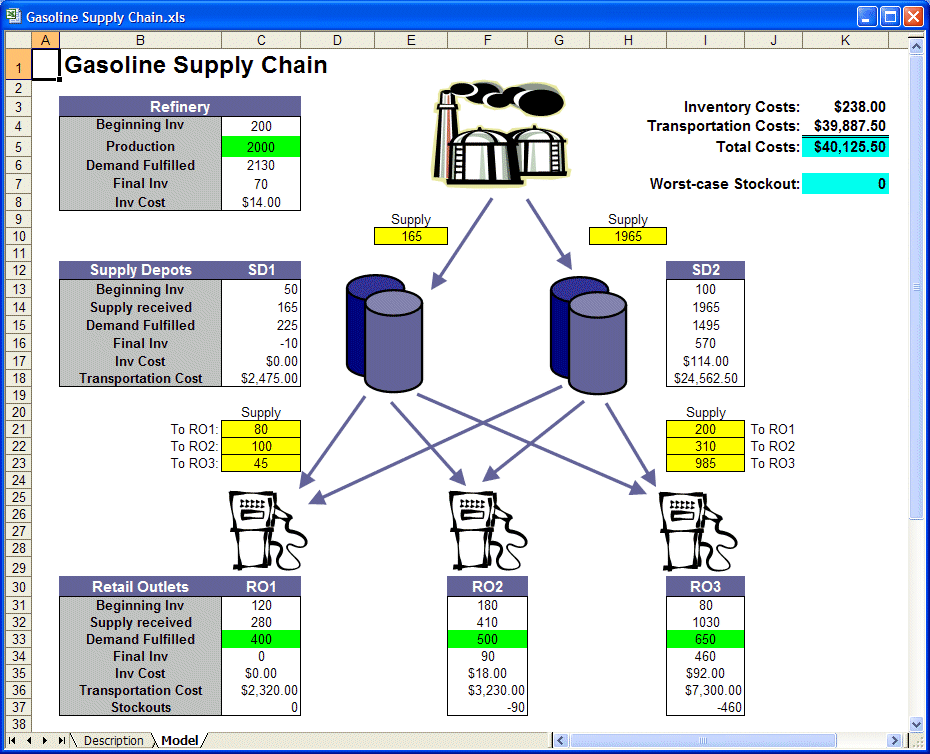
Open the spreadsheet model for this example, Gasoline Supply Chain.xls, as shown in Figure 61, Gasoline supply chain spreadsheet model.
Four Crystal Ball assumptions in cells C5, C33, F33, and I33. These represent stochastic output from the refinery and stochastic demand at the retail outlets.
Two Crystal Ball forecasts in cells K5 and K7 to represent total costs and the worst-case stockout situation.
Eight decision variables that represent transportation costs from the refinery to the two supply depots and from each depot to each retail outlet. These appear in cells E10, H10, C21, C22, C23, I21, I22, and I23.
For this example, OptQuest can determine how much to supply at each of the SDs and ROs to minimize the total expected cost while maintaining stockouts at ROs at an acceptable level.
