Except where indicated, this example uses the recommended Crystal Ball run preferences. See Setting Crystal Ball Run Preferences. |
 With Gasoline Supply Chain.xls open in Crystal Ball:
As you click Next to step through the problem, note:
The problem has one requirement: the 95th percentile of the worst-case stockout forecast must be less than 0 gallons.
This problem has eight discrete decision variables, with bounds of 0 to 2000. These represent transportation costs among the various elements of the supply chain.
The problem has two constraints (Figure 62, Gasoline supply chain constraints) that specify that both links of the supply chain (running through SD1 and SD2) must have sufficient inventories of gasoline.
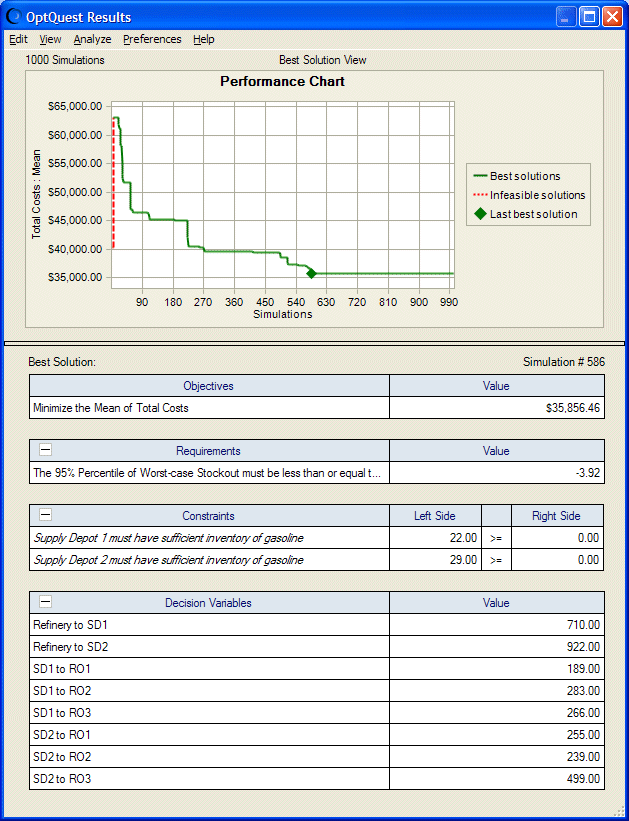
Figure 63, Gasoline supply chain model optimization results shows sample OptQuest results.
Figure 63, Gasoline supply chain model optimization results shows that if the quantities of gasoline shown for each decision variable are transported between the indicated destinations, the mean total cost will be $35,856.46 and the 95th percentile of the worst-case stockout will be -3.92, less than 0.
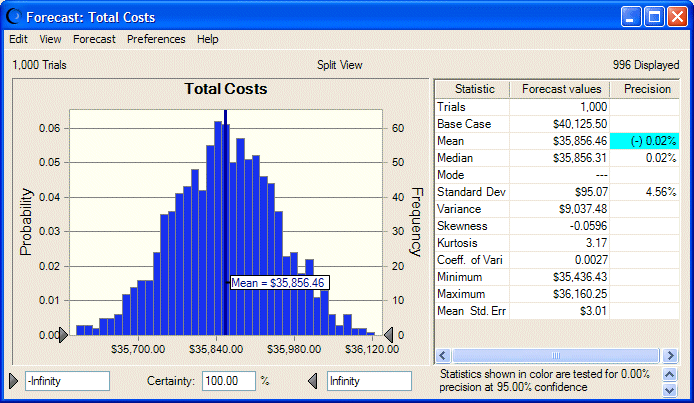
Figure 64, Total Costs forecast chart and statistics, following, shows the Total Costs forecast chart and statistics for the simulation of this solution. The Total Costs standard deviation ($95.07) is quite small relative to the mean total cost ($35,856.46), suggesting that this cost forecast is an accurate representation of the true weekly costs.


