The initial reason that Monica needs to forecast is to maintain enough ingredients to keep up with production. Monica's distributors give her discounts for buying in bulk. However, she must balance this savings with maintaining product quality, which requires using the freshest ingredients possible. Monica wants improved forecasting to help her place orders that give her the best volume pricing while maintaining the quality of her products.
To follow along with this example, open Bakery.xls as described in About These Examples.
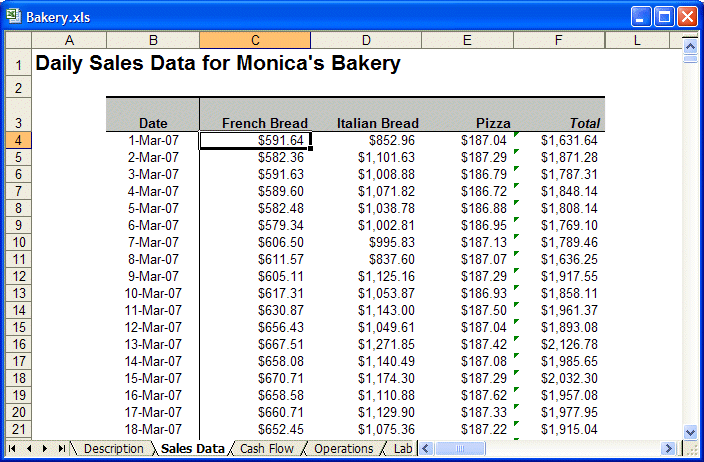
The Sales Data worksheet (Figure 22, Bakery Sales Data Worksheet) shows the daily sales data of each of these products from the opening until the end of June 2010.
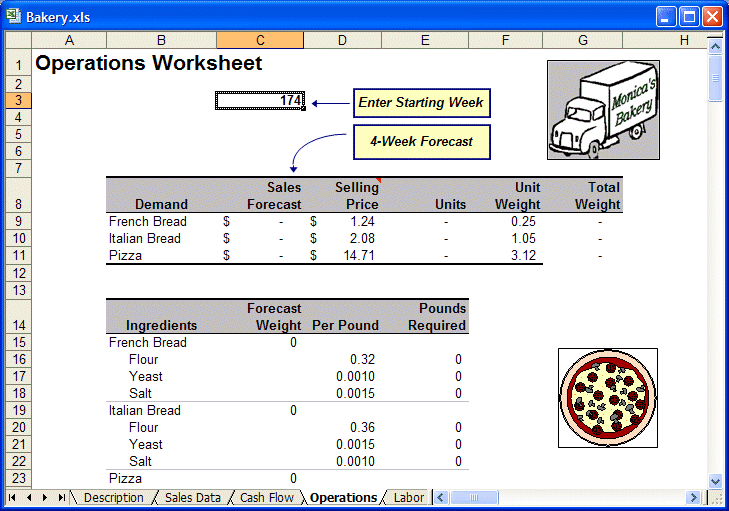
A summary of data for the three main products by week is displayed at the bottom of the Operations worksheet (Figure 23, Bakery Operations Worksheet). Monica can change the table to summarize her results by product, by time period, and more.
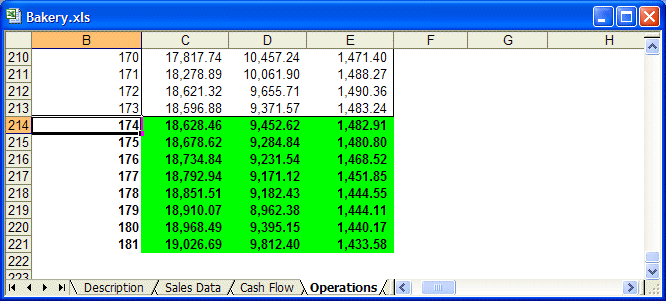
Monica wants to order monthly, one month in advance. The bakery has already received this month’s delivery, which she placed last month. This month, she must place the order that will be delivered at the end of this month for the next month, so she must forecast sales for the next two months. Because she is in week 173 of her business, the forecast is for weeks 174 to 181.
 To forecast the sales for weeks 174 to 181:
Select one cell—for example, C41—in the Historical Demand By Week table at the bottom of the worksheet.
The cell range $B$40:$E$213 is selected correctly on the Input Data panel, with headers, dates, and data in columns settings also selected
The Data Attributes panel shows time periods are in weeks with Seasonality set to AutoDetect
In the Methods panel, Multiple Linear Regression is cleared and all time-series methods are selected
Options settings are the defaults, RMSE and Standard forecasting
In the Predictor Results window, set Periods to forecast to 8, and then click Paste.
In the Paste Forecasts to Spreadsheet dialog, use the following settings and click OK:
Select At end of historical data to indicate where to paste results.
Select Include date series to list dates in the first column.
Select Paste forecasts as Crystal Ball assumptions.
Confirm that AutoFormat is selected.
The results paste to the end of the Historical Demand table as shown in Figure 24, Forecasted Bakery Operations Results.
The last four weeks of forecast values for each data series are automatically summed and placed into the table at the top of the spreadsheet, in the Sales Forecast column (cells C9:C11). In this table, the monthly sales forecast is converted to the number of items sold and then into the weight of each product.
The second table (below this top table) takes the total weight of each product (in cells C15, C19, C23) and calculates how much of each ingredient is required to produce that much product. The ingredients for each are then summed in the third table (below the second table) into the total amounts to order for the month (cells D31 to D34).


