Monica is always concerned about the bakery’s month-to-month cash flow (on a percent of sales basis). Predictor can help her manage her inventory, and she can use it to predict her revenue and understand her cash flow situation better. Understanding the bakery’s cash flow can, in turn, help her better manage major capital expenditures.
Monica is considering two major capital expenditures: a flour silo and a delivery van. She wants to start construction on the silo in July and purchase the delivery van in August. She needs to forecast when the bakery can safely pay for these projects or whether the bakery must finance them.
To follow along with this example, open Bakery.xls as described in About These Examples. If Bakery.xls is already open from the previous example, select Run, Reset to clear any existing results.
Note: | Any pasted data will remain until you clear it in Microsoft Excel. |
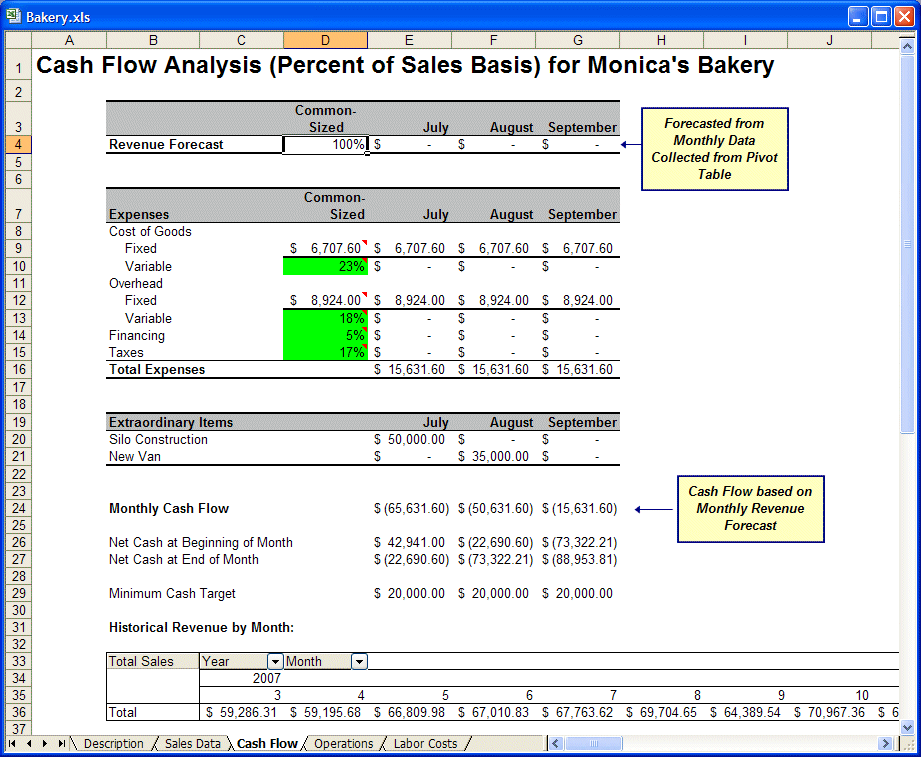
The bakery cash flow information is laid out in the Cash Flow worksheet, shown in Figure 25, Bakery Cash Flow Worksheet.
This worksheet has a table at the bottom that summarizes the sales data for the bakery’s three main products by month. You can forecast the next three months of revenue to decide when to attempt the capital expenditures.
 To forecast the next three months of revenue:
Select one cell—C36, for example—in the Historical Revenue By Month table at the bottom of the worksheet.
Predictor automatically selects all the data in the Historical Revenue table.
Confirm the following settings:
In the Input Data panel, the cell range $C$36:$AP$36 is selected correctly, with Data in rows selected and no date or header settings selected.
In Data Attributes, the first setting is Data is in periods with Seasonality set to AutoDetect.
In Methods, all time-series methods are selected and Multiple Linear Regression is cleared (if available).
Options settings are the defaults: RMSE and Standard forecasting.
In the Predictor Results window, enter 3 for Periods to forecast.
Click Paste, and then, in the Paste Forecasts to Spreadsheet dialog, confirm that results are set to paste at the end of historical data as Crystal Ball assumptions and click OK.
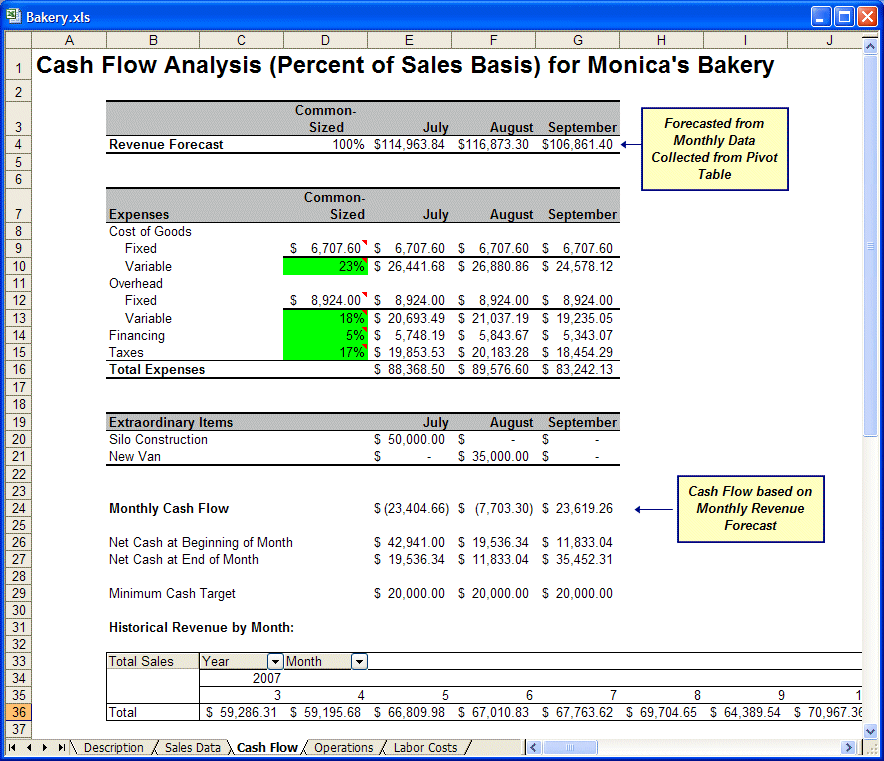
The results paste into the table at the bottom of the worksheet, cells AQ36 to AS36, and also appear at the top of the worksheet (cells E4 to G4) as shown in Figure 26, Monthly Net Cash Flow Results.
The revenue forecasts for the next three months are used to calculate the percentage expenses in the second table.
The second table calculates the total expenses, and the third table calculates the necessary expenditure for each extraordinary item. Below these tables is the cash flow summary for the next three months, based on the forecasts. The net cash at the end of each month is what Monica is looking for (row 27). Based on forecasted sales, the new net cash values are $19,536.34 for July, $11,833.04 for August, and $35,452.31 for September. Based on the forecast, the bakery should wait until September to buy the van.

