Monica's Bakery is a labor-intensive operation that pays a competitive wage. However, to maintain her target profitability, Monica must control labor costs. She knows there are many things done around the bakery that could be done by expensive machinery, such as kneading, mixing, and forming. By accurately predicting her labor costs, she can decide when to invest in some of this equipment to keep her total expenses within budget.
From her interest in economics, Monica knows that a few key macro-economic figures drive labor costs, such as the Industrial Production Index, local CPI, and local unemployment. All of these figures are available on the Internet on a monthly basis from the Bureau of Labor Statistics and the Department of Commerce.
To follow along with this example, open Bakery.xls as described in About These Examples. If Bakery.xls is already open from the previous example, select Run, and then Reset to clear existing results.
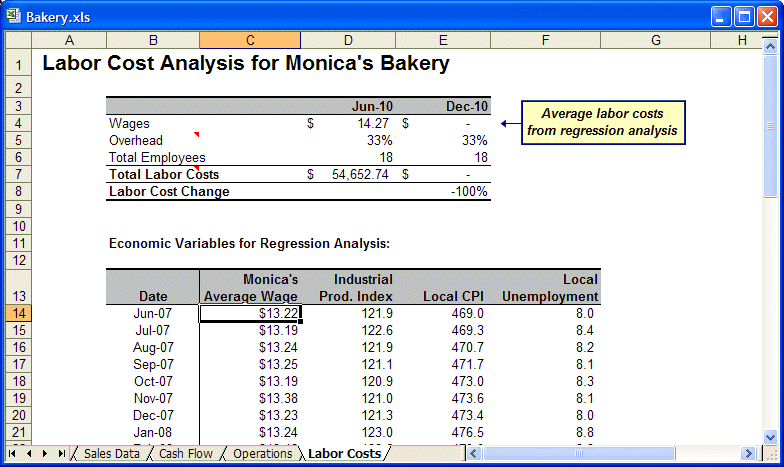
Monica has created her Labor Costs worksheet with an interactive table at the bottom that lists the bakery's average hourly wage for each month and the monthly numbers for the three economic indicators.
The average hourly wage depends on or is affected by the other three variables. Because of the dependency, Monica decides to use regression instead of time-series forecasting. For regression, the dependent variable is Monica’s Average Wage, and the other three are the independent variables.
 To forecast the hourly wage using regression:
Select one cell—for example, C14—in the Economic Variables for Regression Analysis table at the top of the worksheet.
In Input Data, the cell range $B$13:$F$50 is selected correctly, with data in columns, header, and date settings also selected
In Data Attributes, the time periods are in months with a Seasonality of AutoDetect
In Methods, Non-seasonal Methods, ARIMA, and Multiple Linear Regression are selected
Regression variables are defined as follows: Monica’s Average Wage is a dependent variable, all the others are independent variables
In the Predictor Results window, set Periods to forecast to 6 and click Paste.
In Paste Forecasts to Spreadsheet, set the controls to paste forecasts as assumptions at the end of historical data with Include date series and AutoFormat selected.
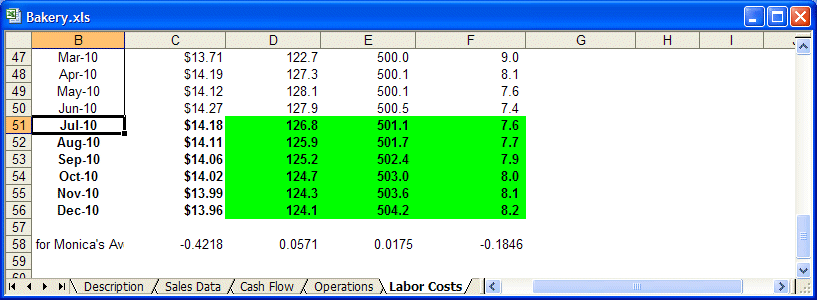
The results paste at the bottom of the table (cells B51 to F56) as shown in Figure 28, Forecasted Labor Costs for Monica’s Bakery. Notice the results for independent variables are defined as assumptions.
Predictor first generates a regression equation to define the relationship between the dependent and independent variables. Second, it uses the time-series forecasting methods to forecast the independent variables individually. Third, Predictor uses those forecasted values to calculate the dependent variable forecast values using the regression equation. See Figure 29, Predicted Labor Cost Increases.
The forecast cells of the independent variables are simple value cells. The forecast cells of the dependent variable are formula cells containing the regression equation and using the forecast values from the independent variables.
The average wage in December is used to calculate the total increase in her payroll. Labor costs actually decrease –2%. With these results, Monica decides that labor costs over the next six months do not justify a major equipment capital purchase.
Exit Bakery.xls without saving the changes.
If you save the changes, you will overwrite the example spreadsheet.


