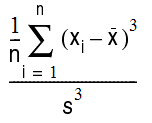
A distribution of values (a frequency distribution) is said to be “skewed” if it is not symmetrical.
For example, suppose the curves in the example below represent the distribution of wages within a large company (Figure 2, Positive and Negative Skewness).
Curve A illustrates positive skewness (skewed “to the right”), where most of the wages are near the minimum rate, although some are much higher. Curve B illustrates negative skewness (skewed “to the left”), where most of the wages are near the maximum, although some are much lower.
If you describe the curves statistically, curve A is positively skewed and might have a skewness coefficient of 0.5, and curve B is negatively skewed and might have a -0.5 skewness coefficient.
A skewness value greater than 1 or less than -1 indicates a highly skewed distribution. A value between 0.5 and 1 or -0.5 and -1 is moderately skewed. A value between -0.5 and 0.5 indicates that the distribution is fairly symmetrical.
Skewness is computed by finding the third moment about the mean and dividing by the cube of the standard deviation.

