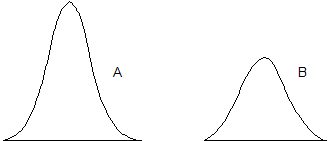
Kurtosis refers to the peakedness of a distribution. For example, a distribution of values might be perfectly symmetrical but look either very “peaked” or very “flat,” as illustrated below (Figure 3, Peaked and Flat Kurtosis).
Suppose the curves in Figure 3, Peaked and Flat Kurtosis represent the distribution of wages in a large company. Curve A is fairly peaked, because most of the employees receive about the same wage, with few receiving very high or low wages. Curve B is flat-topped, indicating that the wages cover a wider spread.
Describing the curves statistically, curve A is fairly peaked, with a kurtosis of about 4. Curve B, which is fairly flat, might have a kurtosis of 2.
A normal distribution usually is used as the standard of reference and has a kurtosis of 3. Distributions with kurtosis values of less than 3 are described as platykurtic (meaning flat), and distributions with kurtosis values of greater than 3 are leptokurtic (meaning peaked).
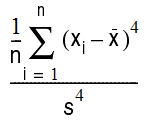
Kurtosis, or peakedness, is calculated by finding the fourth moment about the mean and dividing by the quadruple of the standard deviation.

