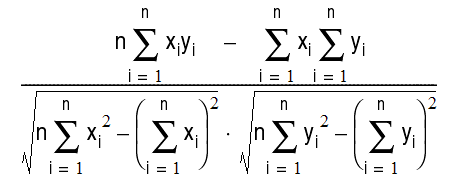
Crystal Ball uses rank correlation to determine the correlation coefficient of variables. For more information on rank correlation, see Rank Correlation. |
When the values of two variables depend upon one another in whole or in part, the variables are considered correlated. For example, an “energy cost” variable likely will show a positive correlation with an “inflation” variable. When the “inflation” variable is high, the “energy cost” variable is also high; when the “inflation” variable is low, the “energy cost” variable is low.
In contrast, “product price” and “unit sale” variables might show a negative correlation. For example, when prices are low, high sales are expected; when prices are high, low sales are expected.
By correlating pairs of variables that have such a positive or negative relationship, you can increase the accuracy of your simulation forecast results.
The correlation coefficient is a number that describes the relationship between two dependent variables. Coefficient values range between -1 and 0 for a negative correlation and 0 and +1 for a positive correlation. The closer the absolute value of the correlation coefficient is to either +1 or -1, the more strongly the variables are related.
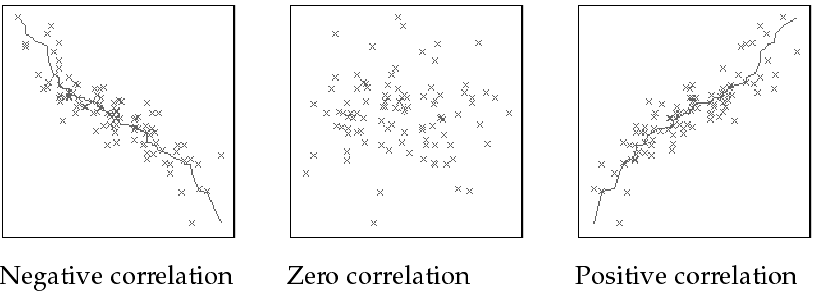
When an increase in one variable is associated with an increase in another, the correlation is called positive (or direct) and is indicated by a coefficient between 0 and 1. When an increase in one variable is associated with a decrease in another variable, the correlation is called negative (or inverse) and is indicated by a coefficient between 0 and -1. A value of 0 indicates that the variables are unrelated to one another. The example below shows three correlation coefficients (Figure 4, Types of Correlation).
For example, assume that total hotel food sales might be correlated with hotel room rates. Total food sales likely will be higher, for example, at hotels with higher room rates. If food sales and room rates correspond closely for various hotels, the correlation coefficient is close to 1. However, the correlation might not be perfect (correlation coefficient is less than 1). Some people might eat meals outside of the hotel, and others might skip some meals.
When you select a correlation coefficient to describe the relationship between two variables in your simulation, you must consider how closely they are related. You should never need to use an actual correlation coefficient of 1 or -1. Generally, you should represent these types of relationships as formulas on your spreadsheet.
Crystal Ball uses rank correlation to correlate assumption values. This means that assumption values are replaced by their rankings from lowest to highest value by the integers 1 to n, before computing the correlation coefficient. This method allows distribution types to be ignored when correlating assumptions. |

