Assumption charts are created automatically when you run a simulation. They cannot be deleted, only opened or closed.
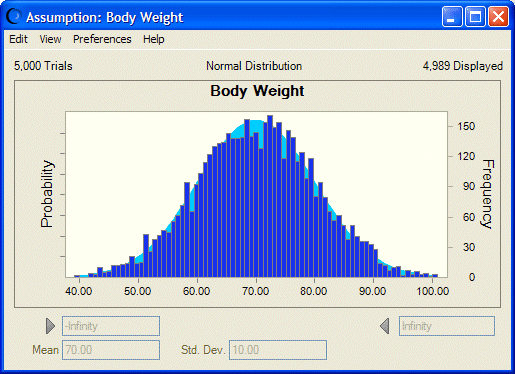
During or after a simulation runs, you can view assumption charts to show trial values (that is, random numbers) for the current simulation layered over the assumption’s ideal probability distribution (Figure 46, Assumption Chart).
Assumption charts are useful for checking and comparing Run Preferences settings. For example, you can look at charts for the same assumption before and after increasing the number of trials and switching between Monte Carlo and Latin Hypercube sampling. If certain settings yield a noticeably better match between the random numbers and the ideal distribution, you might want to use those settings even if the simulation runs longer.
For customization instructions, see Customizing Assumption Charts.

 To open an assumption chart: