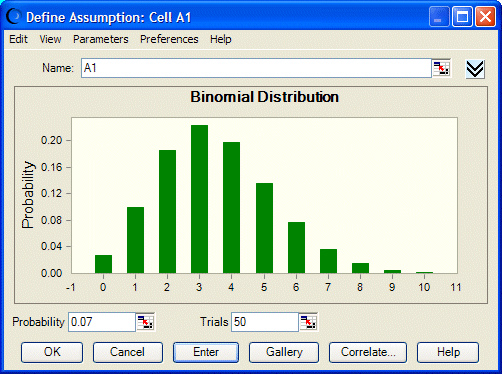
You want to describe the number of defective items in a total of 50 manufactured items, 7% of which (on the average) were found to be defective during preliminary testing.
The first step in selecting a probability distribution is matching the data with a distribution’s conditions. Checking the binomial distribution:
There are only two possible outcomes: the manufactured item is either good or defective.
The trials (50) are independent of one another. Any given manufactured item is either defective or not, independent of the condition of any of the others.
The probability of a defective item (7%) is the same each time an item is tested.
These conditions match those of the binomial distribution.
The parameters for the binomial distribution are Probability and Trials. In example one, the values for these parameters are 50 (Trials) and 0.07 (7% Probability of producing defective items). You would enter these values to specify the parameters of the binomial distribution in Crystal Ball.
The distribution illustrated in Figure 97, Binomial Distribution shows the probability of producing x number of defective items.
