An aerospace company wants to determine the number of defects per 100 square yards of carbon fiber material when the defects occur an average of 8 times per 100 square yards.
The first step in selecting a probability distribution is matching the data with a distribution’s conditions. Checking the Poisson distribution:
These conditions match those of the Poisson distribution.
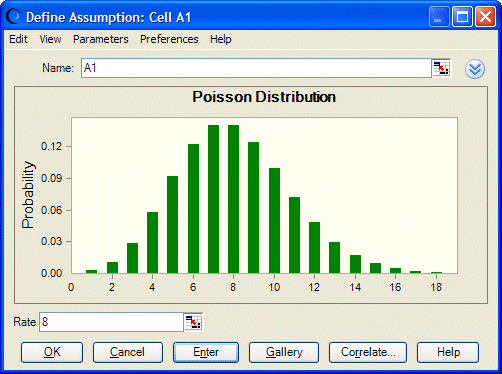
The Poisson distribution has only one parameter: Rate. In this example, the value for this parameter is 8 (defects). You would enter this value to specify the parameter of the Poisson distribution in Crystal Ball.
The distribution illustrated in Figure 106, Poisson Distribution shows the probability of observing x number of defects in 100 square yards of the carbon fiber material.
The size of the interval to which the rate applies, 100 square yards in this example, has no bearing on the probability distribution; the rate is the only key factor. If needed for modeling a situation, information on the size of the interval must be encoded in the spreadsheet formulas.
