 Before beginning example two, clear the values entered in example one as follows:
Right-click in the chart and choose Clear Distribution from the menu.
In this example, you will use the custom distribution to describe a continuous range of values, since the unit cost can take on any value within the specified intervals.
Choose Parameters, then Continuous Ranges to enter value ranges.
Crystal Ball displays a continuous value bar for the range 5.00 to 15.00, as in Figure 113, A Continuous Custom Distribution, and returns the Crystal Ball cursor to the Minimum field. Notice that the height of the range is 0.075. This represents the total probability divided by the width (number of units) in the range, 10 (Figure 113, A Continuous Custom Distribution).
Enter the second range of values:
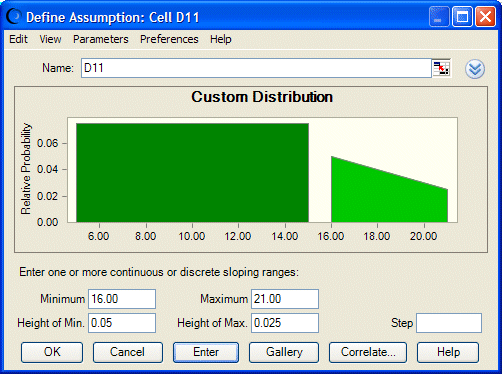
Crystal Ball displays a continuous value bar for the range 16.00 to 21.00. Its height is .050, equal to .25 divided by 5, the number of units in the range. Both ranges now are displayed in the Custom Distribution dialog (Figure 114, Custom Distribution with Two Continuous Ranges).


You can change the probability and slope of a continuous range, as described in the following steps:
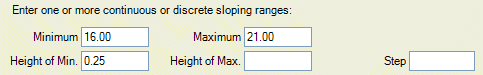
Choose Parameters, then Sloping Ranges.
Additional parameters are displayed in the Custom Distribution dialog (Figure 115, Sloping Range Parameters, Custom Distribution Dialog).
Set the Height of Min. and Height of Max. equal to what currently is displayed in the chart, 0.05.
This can be an approximate value. The Height of Min. is the height of the range Minimum and the Height of Max. is the height of the range Maximum.
The range returns to its original color and its height is displayed unchanged.
Click in the range again to select it and set the Height of Max. to 0.025. Then, click Enter.
The second side of the range drops to half the height of the first, as shown in Figure 116, Sloping Continuous Value Range. The range is selected to show its parameters after the change.
Optional: Change the range from continuous to discrete values by adding a step value. Type .5 in the Step field and click Enter.
The sloped range is now discrete. Separate bars are displayed at the beginning and end of the range and every half unit in between (16, 16.5, 17, 17.5 and so on until 21), as shown in Figure 117, A Sloped Discrete Range with Steps of .5. If the discrete range represented money, it could only include whole dollars and 50-cent increments.
You can enter any positive number in the Step field. If you entered 1 in this example, the steps would fall on consecutive integers, such as whole dollars. Leave the Step parameter blank for continuous ranges.
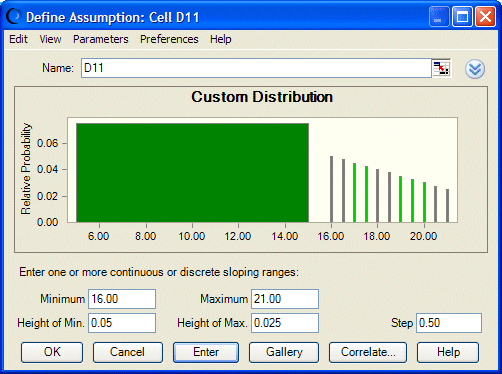
Although the bars have spaces between them, their heights and the width of the range they cover are equal to the previous continuous sloped range and the total probability is the same.
While a second continuous range could have extended from 15 to 20, the second range in this example starts at 16 rather than 15 to illustrate a discrete range because, unlike continuous ranges, discrete ranges cannot touch other ranges.
With Crystal Ball, you can enter single values, discrete ranges, or continuous ranges individually. You also can enter any combination of these three types in the same Custom Distribution dialog as long as you follow these guidelines: ranges and single values cannot overlap one another; however, the ending value of one continuous range can be the starting value of another continuous range.