You wonder how much you would need to reduce variation in Document Verification time before overall quality would improve significantly. You decide to increase the probability of a cycle time of four days or less.
 To do this:
Select cell C18 and open the Define Assumption dialog.
As shown in Figure 168, Document Verification Assumption, Adjusted, the two parts of this assumption are both uniform in height over their range, although the first, lower-value one is nine times taller.
This assumption was previously displayed in Figure 162, Custom Assumption for Step 3, Document Verification. Because the probabilities in the table are linked to workbook cells, when you adjusted the workbook, you also adjusted the assumption probabilities.
Review the forecast chart in Figure 169, The Cycle Time Forecast with Process Capability Metrics.
Crystal Ball sets the upper certainty level at the USL/Target value (96). If the lower certainty grabber is not located at –Infinity, click the lower grabber and drag it toward the Probability axis as shown in Figure 169, The Cycle Time Forecast with Process Capability Metrics. Now, the certainty of cycle time falling at or below the USL is about 78%. You decide to make a drastic change and edit the assumption parameters for Document Verification as follows (change 32 to 24 in the first row; change 90% to 100% and 10% to 0%):
Now, there is 100% probability that all document verification times will fall between two and three days.
Figure 170, Cycle Time Forecast after Adjusting Document Verification shows that when you run with this new assumption definition, the certainty of falling at or below the USL rises to about 93.5% and PPM-total drops to 62,548. Also, the distribution is now normal; it was not normal for the last simulation. Z-USL and Zst-total are 1.53, the sigma level for this simulation.
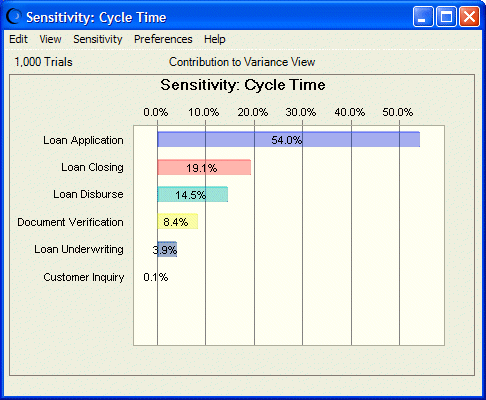
You check the sensitivity chart for this simulation (Figure 171, Sensitivity Chart after Adjusting Document Verification)and find that the impact of Loan Application is now much greater than Document Verification.
You believe that Document Verification has been pared down about as much as it can be, so you decide to experiment further with making the Loan Application cycle time shorter and more consistent.
Results are much better. Figure 172, Forecast Chart after Loan Application Adjustment shows that the mean cycle time has dropped to 74 hours. The certainty of falling below the USL/Target value is 100% and the sigma level has risen to 3.09. Cpk-upper and Cpk have risen over 1 which, given the shape and location of the distribution, confirms that the sigma level is greater than 3.
When you check the sensitivity chart (Figure 173, Sensitivity Chart after Loan Application Adjustment), Loan Closing and Loan Disbursement are now the main contributors to cycle time variation. You learn that these processes might be difficult to improve further, so you decide to implement improvements to Document Verification and Loan Application cycle times and then move into the Control phase, discussed in Control Phase.


