 To determine the certainty level for a specific value range using certainty grabbers:
Make sure the forecast chart to use is the active (selected) window.
Move the certainty grabbers on the forecast chart, as shown in Figure 23, Moving a Certainty Grabber.
Click the grabber and then drag it when the cursor changes to a hand.
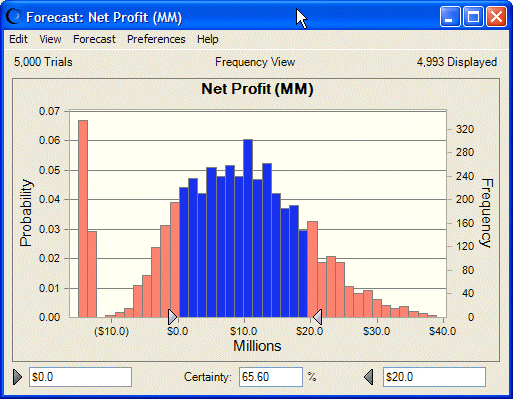
The certainty minimum field shows the value that corresponds to the position of the lower-value (left) certainty grabber; the certainty maximum field shows the value that corresponds to the position of the higher-value (right) certainty grabber. The Certainty field shows the certainty level for the area between the certainty grabbers. Crystal Ball shades the columns outside the certainty grabbers a different color to show that those values have been excluded, as illustrated in Figure 24, Certainty level: values $0 to $20 (in Millions).
The Net Profit forecast chart in Figure 24, Certainty level: values $0 to $20 (in Millions) is the same as the example preceding it, except that the certainty grabbers have been moved. The certainty minimum shows $0.0 and the certainty maximum shows $20.0. The key statistic is the certainty level of 65.6% in the Certainty field. By moving the certainty grabbers, you have changed the certainty range. Crystal Ball compares the number of values lying within the certainty range to the number of values in the entire range — from negative $14.7 million to positive $34.4 million — to recalculate the certainty level. With a certainty level of 65.6%, you can be 65.6% confident of making a net profit between $0 and $20 million.

