Similar to the distribution fitting with historical data described in Fitting Distributions to Data, you can fit standard probability distributions to forecasts in an overlay chart, in addition to comparing forecasts to each other.
You can fit distributions to forecasts in overlay charts two ways:
Choose Overlay, then Fit Probability Distributions in the overlay chart menubar to do a quick fit with the default or currently selected distributions and ranking method. You can also use this command to switch off distribution fitting that is set with either the Overlay menu or Preferences menu.
Choose Preferences, then Overlay, then Overlay Window in the overlay chart menubar to specify particular distributions and to choose one of three fit ranking methods. Then, you can also change the fit options or use Apply To to set these preferences for other overlay charts.
 To fit a probability distribution to all forecasts in an overlay chart using the Preferences, then Overlay command:
Follow the steps for forecast charts given in Fitting a Distribution to a Forecast. Wherever the instructions say Forecast, as in Preferences, then Forecast, substitute Overlay.
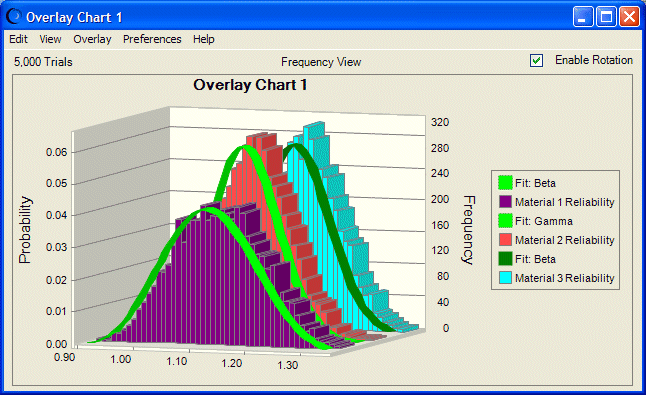
Crystal Ball fits the distributions, and then displays a probability distribution for each forecast as shown in Figure 41, Overlay Chart with Forecasts and Lines of Best Fit. As the legend shows, the forecast in the middle fits best to a gamma distribution, while the other two are beta fits. The Series tab of the Chart Preferences dialog was used to change the colors of the lines of best fit for greater contrast in the figure.
Note:
This overlay chart is shown in 3D, rotated view with legend to the right.
You can copy overlay charts and paste them into other applications. For more information, see Copying and Pasting Charts to Other Applications.
