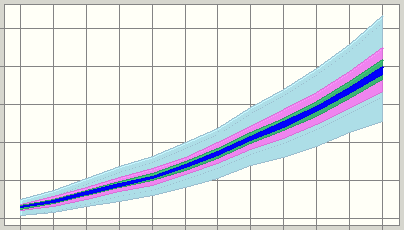
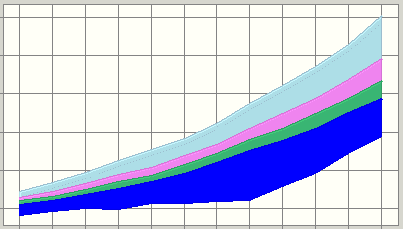
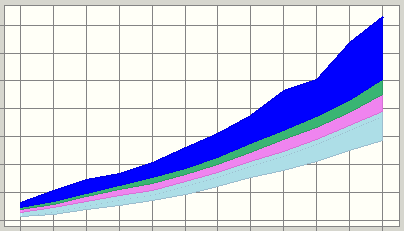
Use the trend chart View menu to change the placement of the certainty bands within the trend chart. The default setting centers the bands around the median of each forecast. You can change the location of the bands so that they are anchored at either the high end or the low end of the projected forecast ranges.
Smaller bands are always displayed on top of larger bands. This obscures the larger bands. Don’t confuse the actual width of a band with the portion that is visible. You can display the true size of a band using the certainty band preferences, described in Setting Certainty Bands. Optionally, you can use these preferences to display the bands one at a time on the trend chart.
 To change the placement of the certainty bands:
Choose one of the views listed in Table 7, following.
Table 7. Trend Chart Views
Alternately, you can choose Preferences, then Trend and choose a view in the View list of the Trend Preferences dialog.
You can use a Crystal Ball shortcut key to bypass the View menu. Each time you press Ctrl+d, the next trend chart view opens.