In this example, you had historical data with no trend or seasonality for all the variables.
If the historical data have a time-series element, trend, or seasonality, you should use Predictor instead of the distribution fitting functionality of Batch Fit.
When the Batch Fit tool runs, it fits each column of data to each selected distribution. For each fit of a distribution to a set of data, the tool calculates the indicated goodness-of-fit test statistic. The distribution with the best fit is placed in the spreadsheet to create an assumption cell that you can copy to the appropriate location in the model.
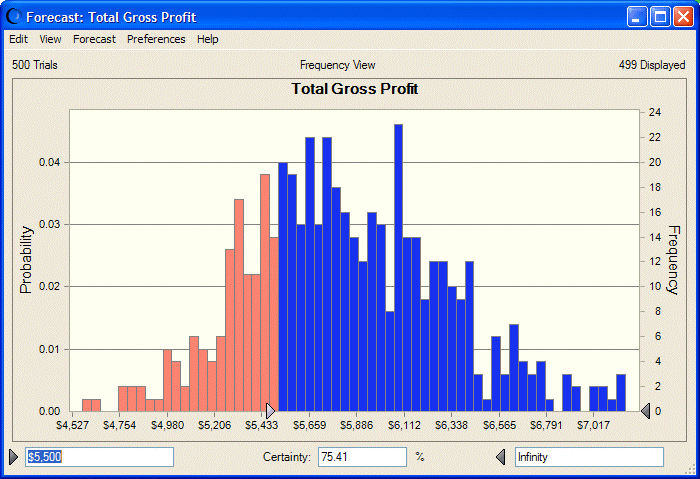
In this example, the four columns of data resulted in four assumptions that you copied and pasted to the appropriate locations. The forecast is already defined for you, and running a simulation produces a forecast chart of the total gross profit from the Magazine Sales workbook. In the Total Gross Profit forecast chart, if you replace –Infinity with $5,500, you find that the certainty or probability of making this amount of profit is about 75% (Figure 61, Magazine Sales profit from newsstand sales).
