In the Crystal Ball Examples folder, there is a Portfolio Allocation.xls workbook you can use to experiment with the Correlation Matrix tool. This spreadsheet calculates the total expected return for an investment model. In this example, you will run a simulation without correlations and then add the correlations and rerun the simulation for comparison.
 To start the Correlation Matrix tool:
In Microsoft Excel with Crystal Ball loaded, open the workbook Portfolio Allocation.xls.
Set the following options in the Run, then Run Preferences dialog:
Run a simulation by selecting Run, then Start Simulation.
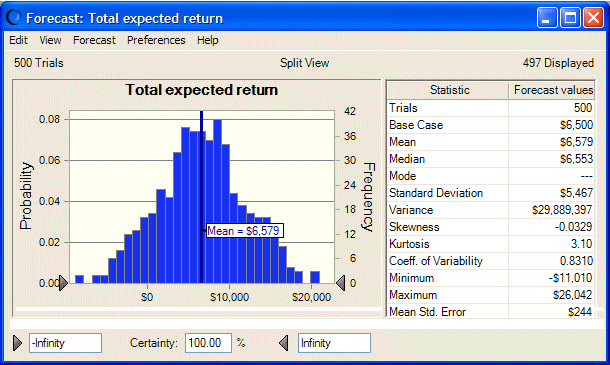
Choose View, then Statistics in the forecast chart. The forecast statistics for the simulation are similar to those shown in Figure 63, Uncorrelated Simulation Statistics, following.
Select Run, then More Tools, then Correlation Matrix. (In Microsoft Excel 2007 or later, select More Tools in the Tools group.)
Include all the assumptions in the correlation matrix by moving all the assumptions from the Available Assumptions list to the Selected Assumptions list using one of these alternatives:
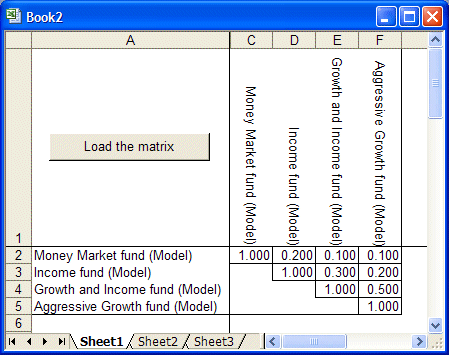
Enter the following correlation coefficients into the matrix.
Leaving a cell blank is not the same as entering a zero. Values that are not specified in the matrix will be filled in with estimates of appropriate values when the simulation runs.
The tool loads the correlation coefficients from the matrix into the Crystal Ball model. Loading a full correlation matrix for all assumptions can take several minutes or even longer.
If a Matrix Successfully Loaded message is not displayed, press Tab or Return to exit the current cell and then click Load The Matrix again.
The forecast statistics for the correlated simulation are shown in Figure 64, Correlated Simulation Statistics.
The standard deviation is now much higher than the original simulation due to the correlations. The original model without the correlations ignored this risk factor and its effects.

 to move it.
