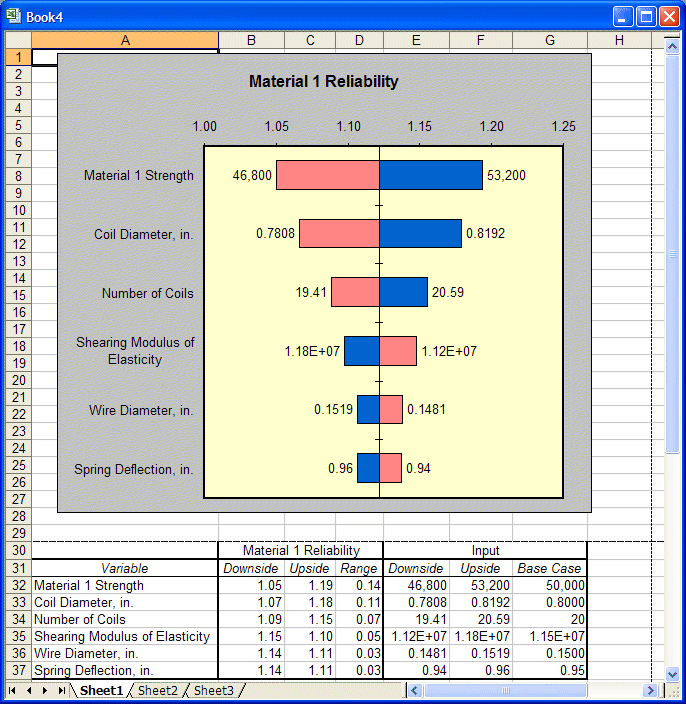
In this example, six assumptions are listed in the tornado chart (Figure 69, Tornado Chart with Data). The first assumption, Material 1 Strength, has the highest sensitivity ranking and is the most important. A researcher running this model would investigate this assumption further in the hopes of reducing its uncertainty and, therefore, its effect on the target forecast, Material 1 Reliability.
The last two assumptions, Wire Diameter and Spring Deflection, are the least influential assumptions. Since their effects on the Material 1 Reliability are very small, you might ignore their uncertainty or eliminate them from the spreadsheet.
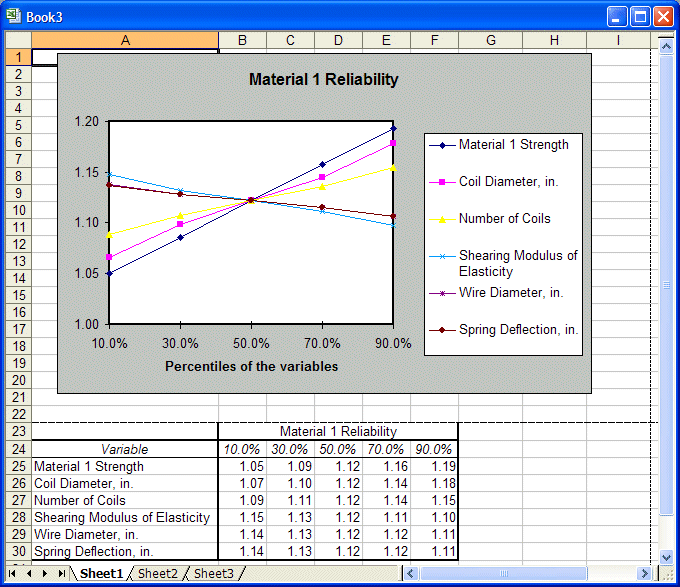
The spider chart shows similar information (Figure 70, Spider chart with Data). Material 1, at the top of the tornado chart, has the steepest positive slope in the spider chart. Notice that more reliability values are given, one for each of five levels within the testing range.

