 To start the Bootstrap tool:
In Microsoft Excel with Crystal Ball loaded, open the workbook Futura Apartments.xls.
Select Run, then More Tools, then Bootstrap. (In Microsoft Excel 2007 or later, select More Tools in the Tools group.)
The first time you run the Bootstrap tool, the Welcome panel opens.
If the Welcome panel opens, click Next.
The Target Forecast panel opens.
Set the target by selecting Profit Or Loss from the forecast list.
Instead, you could choose "Or, enter a data range:" and enter a range of spreadsheet data cells to be used for resampling.
The Method panel opens.
Make sure the one-simulation method and the statistics options are selected.
If you choose Percentiles and then choose Custom, you can select 0 or 100 as well as values between these.
The Options panel opens.
Number Of Bootstrap Samples = 200
Number Of Trials Per Sample = 500
Show Only Target Forecast is selected
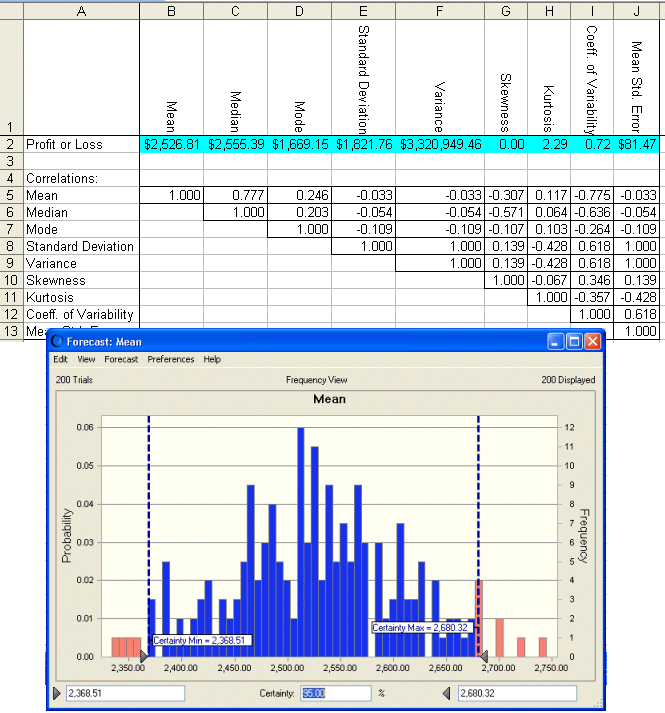
The Bootstrap tool displays a forecast chart of the distributions for each statistic and creates a workbook summarizing the data (Figure 72, Bootstrap Example Results).
Note:
If distribution fitting is turned on for the target forecast, it is turned off during the running of simulations within the tool. When simulations finish, distribution fitting is restored.
Notice that the forecast certainty is set to 95%, the precision control confidence level that is displayed on the Trials tab of the Run Preferences dialog.
Other statistics are also calculated, although they are not displayed.
