The Bootstrap tool displays sampling distributions in forecast charts for the following statistics:
When you use the multiple-simulation method, the tool also displays sampling distributions for these statistics:
For percentiles, the Bootstrap tool displays the percentile sampling distributions on the overlay and trend charts. To display the individual percentile forecast charts, select Analyze, then Forecast Charts.
If you have the Probability Above A Value option selected in the Run Preferences, then Options panel, the percentiles are reversed in meaning, so that the 1st percentile represents the uppermost 1% and the 99th percentile represents the lowest 1%. For more information on this reversal, Setting Statistics Preferences |
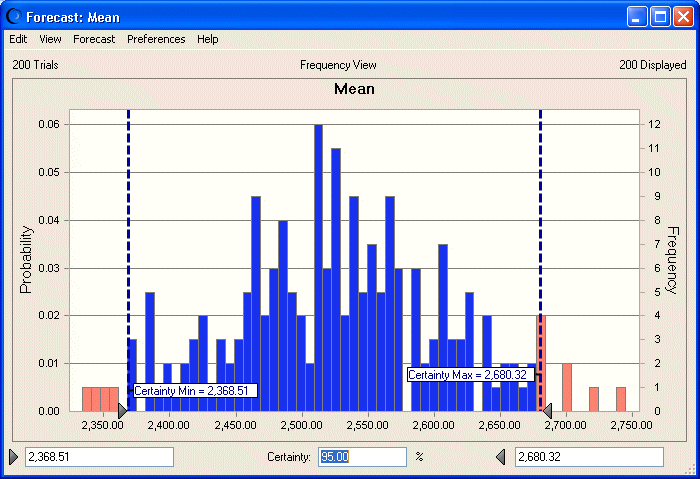
The forecast charts visually indicate the accuracy of each statistic (Figure 73, Bootstrap forecast distribution for the mean). A narrow and symmetrical distribution yields more precise statistics estimates than a wide and skewed distribution.
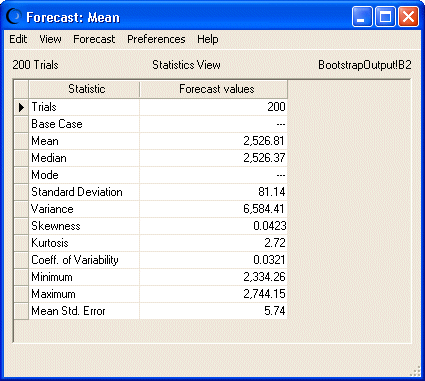
The Statistics view (Figure 74, Bootstrap forecast statistics for the mean) further lets you analyze the statistics’ sampling distribution. If the mean standard error or coefficient of variability is very large, the statistic might not be reliable and might require more samples or more trials. This example has a relatively low standard error and coefficient of variability, so the forecast mean is an accurate estimate of the population mean.
The results workbook has a correlation matrix showing the correlations between the various statistics. High correlation between certain statistics, such as between the mean and the standard deviation, usually indicates a highly skewed distribution.
You can also use the Bootstrap tool to analyze the distribution of percentiles, but you should run at least 1,000 bootstrap samples and 1,000 trials per sample to obtain good sampling distributions for these statistics (according to Efron and Tibshirani; see Bibliography).

