 To run the Scenario Analysis tool on the Toxic Waste Site model:
In Microsoft Excel with Crystal Ball loaded, select Help, then Crystal Ball, then Examples Guide, and then select Toxic Waste Site in the name list. (For Microsoft Excel 2007 or later, select Resources and then Examples Guide in the Help group.)
Select Run, then More Tools, then Scenario Analysis. (In Microsoft Excel 2007 or later, select More Tools in the Tools group.)
In the Target Forecast panel, select Risk Assessment.
Note:
If Welcome opens, select Next to display Target Forecast.
In the Range of forecast results group, specify a percentile range from 95 to 100 percent.
In the While running group, select Show only target forecast.
In the Simulation control group, enter 1000 as the maximum number of trials to run.
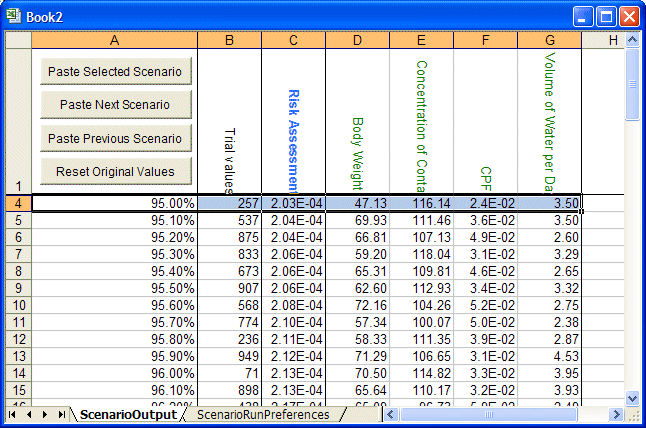
Scenario Analysis creates a table of all the forecast values within the range specified in step 5, along with the corresponding value of each assumption (Figure 79, Scenario Analysis Results for Toxic Waste Site).
Even if you have not selected Stop On Calculation Errors in the Run Preferences dialog, the Scenario Analysis tool stops on calculation errors. In that case, reported results are not fully representative and differ from those produced following a complete, error-free simulation. The original setting is restored when the Scenario Analysis tool closes.
Select the row with the 98.00% (assuming percentile display is set to the defaults, Probability below a value and 10%, 90%, etc.).
Click Paste Selected Scenario.
The scenario of assumption values that produced the 98th percentile value of the target forecast is displayed in the Toxic Waste workbook. Crystal Ball recalculates the workbook and updates the forecast cells.
In the workbook, the assumption and forecast values change to the values for the next scenario (for 98.10%).
The original assumption and forecast values are displayed in the workbook.
Note: | If you have stochastic elements in the model other than Crystal Ball assumptions—for example a RAND() function, a random value returned by a macro, or even a Crystal Ball probability spreadsheet function such as CB.Normal(), the value for that stochastic element is not pasted into the model with the Paste buttons on the Scenario Analysis tool's output spreadsheet. True scenario analysis cannot be performed in this case; if the target forecast is a function of these other elements, the forecast values do not match. |
