The Dashboard Architect User Interface

The main Dashboard Architect screen is divided into numbered segments, as illustrated in the figure. Each segment is described in Table 5.
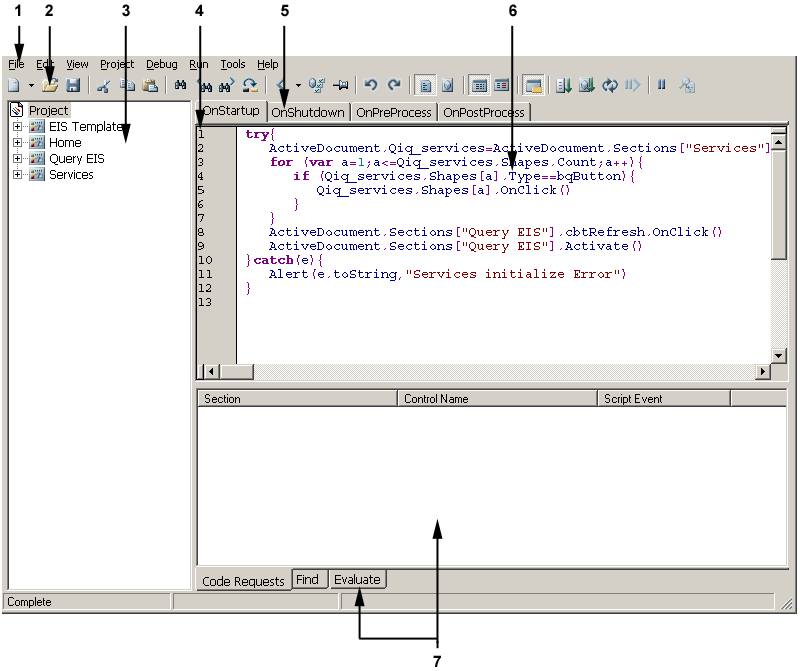
The image shows the main Dashboard Architect screen and is described in the table following the screen.

Table 5. Interface Descriptions

Item Label

Description

1. Menu bar

Access to Dashboard Architect features (Some menu bar entries provide common keyboard shortcuts and use buttons to activate functionality)

2. Toolbar

One-click access to the most functionality

3. Navigation panel

The panel contains one of these modes:

  1. Sections and the programmable elements within them in the form of an expanded or contracted tree view. The editing window (6) displays the JavaScript associated with the selected programmable element.

  2. Interactive Reporting Studio objects available in the instrumented Interactive Reporting document in the form of an expandable tree view. Double-click an object, method, or property, and the associated syntax is added at the cursor position in the editing window (6).

4. Line number

Line number indicator

5. Event handlers

Displayed as content tabs for sections or controls at the top of the editing window (6)

6. Editing window

Edit JavaScript or examine executed code with breakpoints

7. Output window and content tabs

The output window contains three content tabs.

  1. Code Requests—Track calls made by instrumented.bqy to the Debug Server for the JavaScript that each object must evaluate. If an error is detected, the last icon in the list is displayed with the red cog over the folder icon (Revise butotn). Clicking a line of code in the output window causes the editing window (6) to display the JavaScript for that event handler.

  2. Find—Display the lines matching a find specification. Clicking a line in the find list causes the editing window (6) to display the JavaScript for that event handler and the cursor is placed where the match is made on the line.

  3. Evaluate—Enable interaction with instrumented.bqy while execution is paused on a breakpoint. Two sub-panes are visible, one in which JavaScript expressions can be entered for evaluation and another in which the results of the evaluation are displayed. The window also contains buttons for debugging: Evaluate button (Evaluate) and Stack Trace button (Stack Trace). Within the evaluate pane Cut button (Cut), Copy button (Copy), or Paste button (Paste) an expression to be evaluated, or click Clear button (Clear) to delete the expression from this window.

Note:

The output window is visible only if Output Window button is clicked or Crtl+W is pressed.