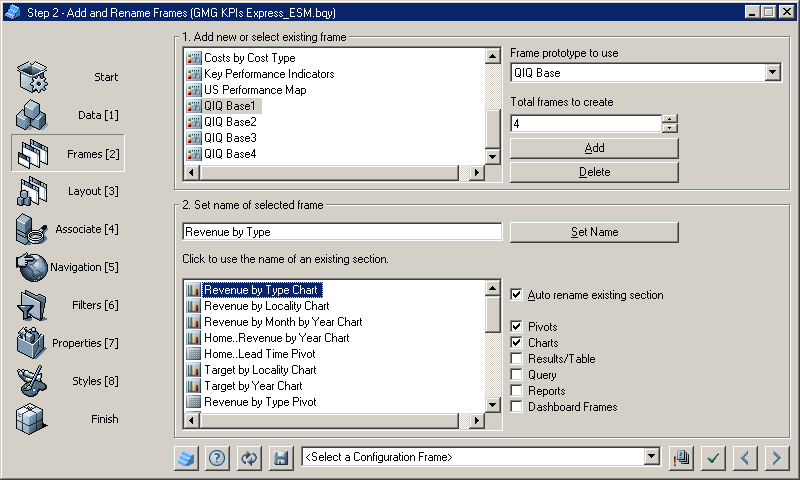
Frames can be added and renamed manually or automatically.
Note:
Some frame prototypes include improved panel descriptions; for example, 4 (2 x 2) Round |–|–|, 2 (1 x 2 Round |—|, 2 (2 x 1) Round | | |, and so on.
 To add or rename a frame manually:
In Step 2: Add and Rename Frames, from Frame prototype to use, select a frame prototype.
Frame prototype availability varies, depending on the Dashboard Studio template.
In Total frames to create, enter the number of frames to be added to the dashboard.
Individual frames need not be assigned for reports or other non-dashboard sections to which access is provided. Instead, use Dashboard Studio to add hyperlinks from frames to sections. See Step 5: Configure Navigation.
Click Add.
The added frames are listed in 1. Add new or select existing frame.
A Home frame is created by default. Rename or delete this frame if it is not applicable. The default Home frame can only be deleted if it is not the only visible section. It is advisable to add all frames and apply changes before deleting Home.
Optional: To remove a frame, select the frame, and click Delete.
The view must contain at least one frame because the final frame cannot be deleted.
After creating the frames, from 1. Add new or select existing frame, select a frame.
The frame prototype that is selected when frames are created is used to create the frames.
Name the selected frame in one of two ways:

Click Set Name.
Duplicate names cannot be created in Dashboard Studio. For example, if sections exist named Revenue by Year Chart and Revenue by Year Pivot, a frame is created called Revenue by Year.
If Auto rename existing section is selected, Dashboard Studio truncates the underlying section name automatically. For example, when Revenue by Type Chart is selected, the frame name is set to Revenue by Type.
Repeat steps 5–7 to name all frames.
Click
 to apply the selections to the dashboard.
Click
 to move to the next step.
Step 3: Drag Pivots, Charts, and Tables onto Frames is displayed.
 To add or rename frames automatically:
In Step 2: Add and Rename Frames, from Frame prototype to use, select a frame prototype.
Click
 to automatically create frames.
Frames are automatically created based on the base name of each section. One frame is created for charts and pivots with matching base names. For example, if sections exist named Revenue by Year Chart and Revenue by Year Pivot, clicking
 automatically creates a frame called Revenue by Year.
If a section group is formed by affixing a prefix to selected section names, a group frame is created based on the prefix. Frames are not created for individual sections.
The frame prototype that is selected when frames are automatically created is used to create the frames.
Click
 to apply the selections to the dashboard.
Click
 to move to the next step.
Step 3: Drag Pivots, Charts, and Tables onto Frames is displayed.