The feature enables you to change the parent of a section so it obtains data from another section. The most common use for the operation is to increase the speed of dashboards that rely on results with many or complex computed items and filters. By creating a table from the results, and placing the filters on the table, recalculating the computed items is avoided each time the filters are set.
When the operation is performed, all charts and pivots that depend on the results must be re-created in the table.
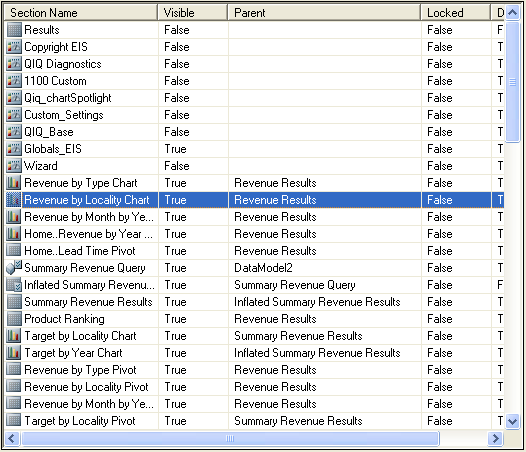
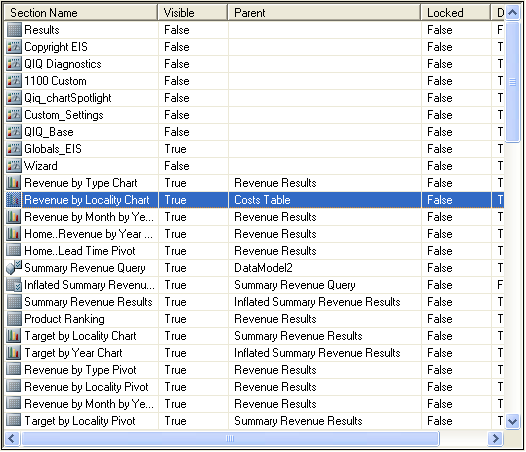
Figure 7, Chart Dependent on Results and Figure 8, Chart Dependent on Table illustrate the effect of the change parent section operation. Figure 7, Chart Dependent on Results, displays a chart as dependent on results. The utility enables you to change the chart parent section to a table. Figure 8, Chart Dependent on Table displays the chart dependency changed to a table.
Note:
The Optimize Utility can re-parent tables.


 To use the Change Parent Section feature:
 .
.